

Les 50 plus beaux graphiques... Studyscape Patrick Vuarnoz Suitmen Life Map par ritwikdey Web Trend Map v4.0 par Information Architects Killer Earth par Andrew Blauvelt Visualization of iTunes Libraries par Caleb Larsen Chart Arcs par Martin Dittus par Peter Crnokrak Netdisco Max Baker Networkism par Tatiana Plakhova Mo Money Mo Problems par Nick Hardeman Twingly Screensaver Time Magazine par Joe Lertola DriftNet par Norimichi Hirakawa Glocal par Jer Thorp Visualizing The Bible par Chris Harrison Barcode Plantage par Daniel A. Fyre par David Trowbridge, Micah Dowty Disarticulate par Ben Fry Visual Poetry par Boris Muller MSN History Visualization par MSN History Visualization flowerGarden par Greg Judelman, Maria Lantin Maeve insatallation par University of Applied Sciences Potsdam AmoebaAbstracts 1-3 par Marius Watz Static Mouvements par Piero Zagami Visualizing information flow in science par Moritz Stefaner Dewey Circles par Syed Reza Ali Gcrawler Marcin “vorg” Ignac Blooming Numbers par Yuri Lee Nexus Looks Del.icio.us par Kunal Anand TuneGlue Air Lines par Mario Freese
Conférence de presse de présentation du livre blanc bluenove « Open Data : quels enjeux et opportunités pour les entreprises ? » le 3 novembre 2011 à Paris Vous pouvez retrouvez ici l’écho que font le média à la publication du livre blanc de bluenove, que vous pouvez désormais télécharger gratuitement. Communiqué de presse officiel bluenove: Boulogne, le 27 octobre 2011 –A l’occasion de la présentation du livre blanc, « Open Data : quels enjeux et opportunités pour l’entreprise ? » en partenariat avec la SNCF, Le Groupe La Poste, Suez Environnement et le Groupe Poult, sur la base de l’étude bluenove – BVA auprès des grandes entreprises françaises ainsi que sur de nombreuses interviews de dirigeants d’entreprises, bluenove organise une conférence de presse le jeudi 3 novembre dans le 9ème arrondissement de Paris. Au cours du premier semestre 2011, bluenove avait étudié l’engouement des grandes entreprises françaises pour l’open innovation. Quels sont les grands principes de l’Open Data ? Pourquoi s’intéresser à l’Open Data ? Quel impact l’ouverture des données peut avoir sur les entreprises ? Premières recommandations issues du livre blanc.
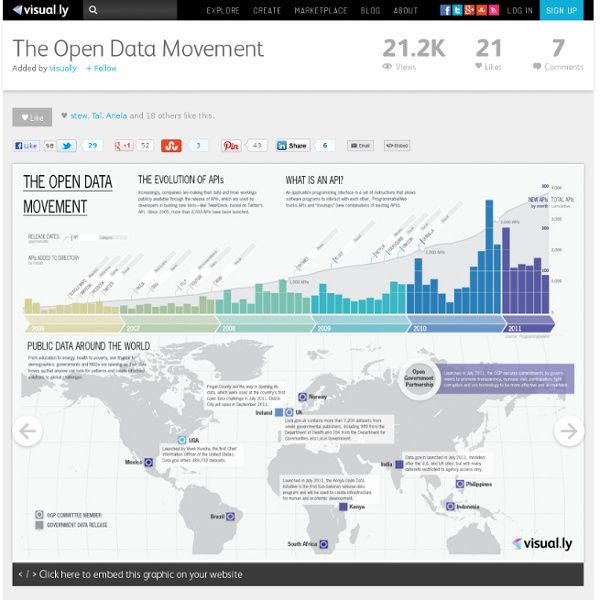
Chart Porn Qu’est-ce que l’open data ? – Des exemples emblématiques ParisData est lancé ! Comme elle l’avait annoncé, la ville de Paris a mis en ligne la semaine dernière un certain nombre de sets de données accessibles à tous. Mapize et bluenove en ont profité pour mettre en ligne mapize.paris.com, tout premier exemple de réutilisation des données ouvertes par Paris. Après en avoir expliqué les grands principes, je vous propose de présenter aujourd’hui, au delà de l’exemple parisien, quelques autres exemples concrets d’initiatives d’ouverture des données, et ce que ces initiatives ont rendu possible. Données publiques avant tout ! Les exemples concrets d’open data concernent très majoritairement, aujourd’hui, des données « publiques », c’est à dire émises par des acteurs publics : gouvernements, collectivités, institutions, etc. La loi, notamment en France, encourage cette présence massive des données publiques dans le panorama de l’open data. Les données publiques ont donc une vocation naturelle à être partagées. Qui émet quel type de données ? A suivre !
Tools on Datavisualization A Carefully Selected List of Recommended Tools 07 May 2012 Tools Flash, JavaScript, Processing, R When I meet with people and talk about our work, I get asked a lot what technology we use to create interactive and dynamic data visualizations. To help you get started, we have put together a selection of the tools we use the most and that we enjoy working with. Read more Pathline: Connecting Designers With Scientists 18 Apr 2012 Tools We recently attended an interdisciplinary visualization workshop that was all about creating a dialogue between scientists, technologists and designers. New Maps for the Web by Stamen 22 Mar 2012 Tools JavaScript, Mapping I just left the Stamen studio where I had a brief chat with founder and CEO Eric Rodenbeck. The Visualizing Player 19 Jul 2011 Showcases, Tools Visualizing.org launched their brand new Visualizing Player, a terrific tool for embedding interactive and static data visualizations. Working with Data in Protovis 17 Feb 2011 Tools JavaScript, Tutorial
Ebook : le cahier de l’OpenData 2010 » Article » OWNI, Digital Journalism Acteur du datajournalism, Owni suit de près le mouvement open data. Les fortunes sont diverses selon les pays. Retour sur les avancées et les reculs de l'année 2010 en dix articles. «Nous ouvrons les gouvernements» : si le slogan de WikiLeaks semble voir été entendu, au moins en partie par les gouvernements anglo-saxons, comme en témoignent les initiatives des Etats-Unis, de la Grande-Bretagne, de l’Australie et du Canada, la majeure partie des pays restent à la marge. Ainsi, les pays européens peinent à suivre le mouvement de l’open data, malgré la mise en place de la directive européenne INSPIRE en 2007, et la France ne déroge pas à cette règle. Les initiatives les plus poussées se développent au niveau local, Bretagne en tête, et le mouvement de l’open data est d’abord porté par les citoyens, les journalistes, les universitaires et les communautés open source. Libérez les données !
A Tour through the Visualisation Zoo Related Content Visualizing System Latency Heat maps are a unique and powerful way to visualize latency data. Explaining the results, however, is an ongoing challenge. Browse this Topic: Queue on Reddit Jeffrey Heer, Michael Bostock, and Vadim Ogievetsky, Stanford University Thanks to advances in sensing, networking, and data management, our society is producing digital information at an astonishing rate. The goal of visualization is to aid our understanding of data by leveraging the human visual system's highly tuned ability to see patterns, spot trends, and identify outliers. Creating a visualization requires a number of nuanced judgments. This article provides a brief tour through the "visualization zoo," showcasing techniques for visualizing and interacting with diverse data sets. Most of the visualizations shown here are accompanied by interactive examples. Time-Series Data Time-series data—sets of values changing over time—is one of the most common forms of recorded data. Index Charts