
40 Useful and Creative Infographics Six Revisions Menu Main Categories CSS HTML JavaScript Web Design WordPress Web Development Design Inspiration UX Design UI Design Freebies Tutorials Tools What Is Web 2.0 by Tim O'Reilly 09/30/2005 Oct. 2009: Tim O'Reilly and John Battelle answer the question of "What's next for Web 2.0?" in Web Squared: Web 2.0 Five Years On. Appstats für Python - Google App Engine The Python SDK includes the Appstats library used for profiling the RPC (Remote Procedure Call) performance of your application. An App Engine RPC is a roundtrip network call between your application and an App Engine Service API. For example, all of these API calls are RPC calls:
The Chevy Volt: An Electric Car With Its Own IP Address CrunchGear’s Matt Burns recently called the Chevy Volt GM’s “knight in shining chrome and white plastic.” Burns was not citing projected sales numbers, instead he was making the point that the Volt has saved GM by forcing the troubled automaker to “change internally and reinvent nearly ever aspect of how it does business.” In support of Burns’ thesis, IBM and GM revealed new details on Monday on the car’s electronic backbone and how it came together in 29 months, from concept to finish. Although the Volt is far from the first car with computer functionality, it is a major technological step forward for GM. Glossary #Hashtags: Hashtags are a way to tag your tweets. They are keywords you use to put your tweet in certain topic. You usually use hashtags when tracking ... [ + more ] 2-Second-Rule: A loose principle that a user shouldn’t need to wait more than 2 seconds for certain types of system response, such as application-switching ... [ + more ]
The Modern Executives Essential Social Media Toolkit Plus [INFOGRAPHIC] Privacy on-line is fast disappearing as search engines and social networks publish information in an instant. Conversations about people and brands are searchable with granular advanced search functions that include dates and specific media such as images and videos. In the last century(as far back as the ancient web time of 1995) there was no Google or Bing to help you find information easily on the web. Finding people or brands using primitive search engine technology at the time such as AltaVista was rather hit and miss and finding something relevant was often buried as far back as page 20 of the search results. Now to find something about a person you only need to put their name into Google and up will come their LinkedIn, Facebook and Twitter profiles. You are Now an Online Brand!
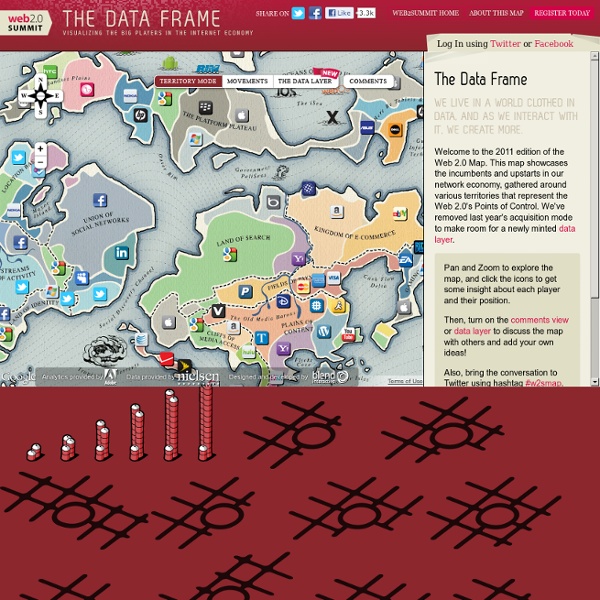
Web 2 Map: The Data Layer – Visualizing the Big Players in the Internet Economy As I wrote last month, I’m working with a team of folks to redesign the Web 2 Points of Control map along the lines of this year’s theme: “The Data Frame.” In the past few weeks I’ve been talking to scores of interesting people, including CEOs of data-driven start ups (TrialPay and Corda, for example), academics in the public dataspace, policy folks, and VCs. Along the way I’ve solidified my thinking about how best to visualize the “data layer” we’ll be adding to the map, and I wanted to bounce it off all of you.
Stunning Infographics and Data Visualization Feb 02 2010 Information graphics, or infographics, are visual representations of information, data or knowledge. The graphics are used where complex information needs to be explained quickly and clearly, such as on signs and maps and in journalism, technical writing and education. Today, infographics surround us in the media, in published works both mainstream and scientific and in road signs and manuals. They illustrate information that would be unwieldy in text form and act as a visual shorthand for everyday concepts, such as “Stop” and “Go.” Memo to Newspapers: Stop Thinking Like a Portal: Tech News and Analysis « Updated: The story of homeless radio announcer Ted Williams became an Internet sensation this week, as a video of him got passed around on Twitter and in the blogosphere, and quickly led to appearances on the Today Show and job offers from around the country. But the video that started it all — an interview with a reporter from the Columbus Dispatch newspaper in Ohio — is no longer available on YouTube. In yet another example of a newspaper that can’t see the forest for the dead trees, there is just a statement from the video-hosting site that the clip “has been removed due to a copyright claim by The Dispatch.” A web editor in the Dispatch newsroom seemed confused when asked why the paper ordered YouTube to take the clip down. “It’s our video, and someone put it there without our permission,” he said.
web design I guess I haven't thought very critically about web design within the context of American society. I'm in Costa Rica working to co-create (i.e. hopefully with the influence of others) a social network for non-gov'tal organizations. Recently I've been seeking feedback about the site in face to face meetings, because I haven't been getting any though digital means (email, chat, feedback forms). What Drives Brand Sociablity? [INFOGRAPHIC] By now, most marketers agree that engaging their brands in social media is a good thing, but they also feel that they could be doing it better According to a survey of 1,897 senior executives conducted by Weber Shandwick in partnership with Forbes Insights, 84% of the execs believe their brand's sociability is not up to world-class standards. What does it take to get there? In the infographic below, Weber Shandwick offers nine tips, including creating your own content for social media and planning social media activity across all channels.
Rapid turnover in the Web 2.0 space – the best get acquired A review of what had happened to the Web 2.0 poster-children prompted me to review what had happened to the companies featured in my Web 2.0 Landscape dating from May 2007. This was one of the elements of our Web 2.0 Framework which has now been downloaded over 150,000 times. In the diagram below the green circles indicate the companies have been acquired, while a red cross shows the company has joined the dead-pool. (This was a quick review so I may have missed things – let me know if so.) If you compare this with the review of the companies in probably the most famous overview of Web 2.0 logos and companies below, my list seems to have been quite a lot more successful, I suppose since I was selecting these as representing a particular aspect of value creation rather than being randomly selected.
Social bookmarking service. Fast tagging and posting to all major social websites - SocialMarker.com The activity of Social Bookmarking has been around for almost two decades. If you have engaged in social media, chances are you’ve participated in it without even realising you have done so. Ever sent a link to a friend knowing they’ll enjoy receiving the content you’ve sent? That in itself is social bookmarking!