Chris Harrison - Visualizing the Bible - Flock
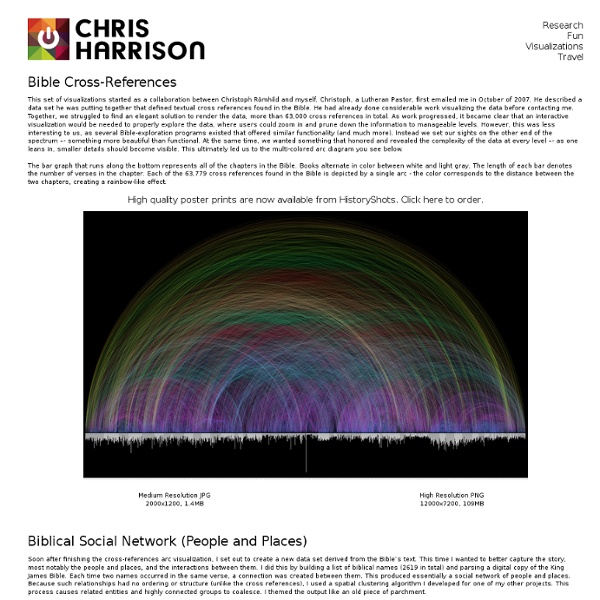
This set of visualizations started as a collaboration between Christoph Römhild and myself. Christoph, a Lutheran Pastor, first emailed me in October of 2007. He described a data set he was putting together that defined textual cross references found in the Bible. He had already done considerable work visualizing the data before contacting me. Together, we struggled to find an elegant solution to render the data, more than 63,000 cross references in total. The bar graph that runs along the bottom represents all of the chapters in the Bible. Soon after finishing the cross-references arc visualization, I set out to create a new data set derived from the Bible’s text. Additional details: Entities with less than 40 connections are drawn at an angle. With the biblical names list already compiled and a copy of the King James Bible sitting on my desktop, another visualization was inevitable. I've provided the visualization in three color themes.
IRC Arcs: Communication Behavior - Flock
A simple visualization of IRC communication behavior: Who is talking to whom? Or, more appropriately: Who is namedropping whom? Circles represent users Arcs represent references … where a reference is a message from a user containing the name of another user. Arcs are directional and drawn clockwise: In the upper half of a graph they point from left to right, in the bottom half from right to left. This visualization favors strong social connections over sociability: Frequent references between the same two users feature more prominently than combined references from several sources to a single target. 1. Emphasis on active users. Circle size = Number of messages Circle color = Average message length 2. Inverted semantics of circle color and circle size. Circle size = Average message length Circle color = Number of messages Martin Dittus 2006-09-30. The graphs were created with Processing. The visualization concept is based on research by Martin Wattenberg.
Codex Sinaiticus Project
peoplemovin - A visualization of migration flows - Flock
Evidence for God from Science
Psalm 22
Related:
Related: