
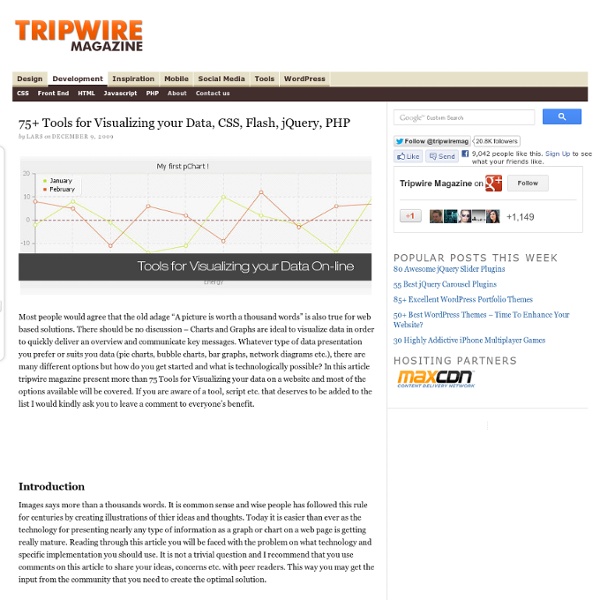
20 Fresh JavaScript Data Visualization Libraries There are plenty of JavaScript libraries out there for rendering your otherwise plain and boring numerical data into beautiful, interactive, and informative visualizations. The beauty of using JavaScript for data visualization is that, if created correctly, your data will be highly accessible (usually via HTML tables). A long time ago (2008), I wrote about JavaScript solutions for graphing and charting data and this article revisits the topic with twenty more JavaScript libraries that you can use to bring your data to life. 1. Highcharts Highcharts is one of the most promising JavaScript charting libraries to hit the scene recently, with its large array of features including seven charting types (line, pie, and bar among them), the ability to zoom in and out of charts, and tooltips for offering more information about data points. 2. gRaphaël gRaphaël is a charting library based on Raphaël, a vector graphics drawing JavaScript library. 3. 4. jQuery Visualize Plugin 5. moochart 6. 7. dygraphs
Very simple login using Perl, jQuery, Ajax, JSON and MySQL Introduction Since the beginning of the WWW, the developers try to equip their Web sites with new features and widgets to attract the users' attention and make the life much easier for them by applying the latest technologies. Nowadays, an average Web user, among other activities, shops, searches for information, registers to forums and communities, plays online games and communicates with the other users on the Internet. For most of these activities the user typically needs to register and then log in to the Web site. These basic features require special care; they need to be simple, fast and secure for the user. From the developer's perspective, thanks to the new techniques, the implementation of these features gets easier every day. In this article, you will learn how to bring a handful of these technologies together and implement a very simple login feature for your Web site. The implementation has been broken down into 4 sections: What is not included in the article? Listing 1. Perl
Jquery Inline css editor Design in the Browser I was inspired by the article Make Your Mockup in Markup by Meagan Fisher. I am one of those persons who can't stand Photoshop and design every bit of a website in it. Also it is not very DRY to design paragraphs, or whatever, in Photoshop and again with CSS. But designing the mockup with markup is also somewhat annoying. That's why I coded this Plugin. Installation and Usage Please see the Demos and the example source code here and here. Download latest Version You always find the latest version of the Plugin at the GitHub repository download page. A Demo Screencast Current Source Code
Roundabout for jQuery by Fred LeBlanc It’s ready-to-go straight out of the box, but if you want to get crazy, Roundabout is highly-customizable with an extensive API that allows for some pretty amazing results. Roundabout requires jQuery (at least version 1.2, successfully tested through version 1.7.2). It works in all major modern browsers and even some of the older, not-so-modern ones. It’s open source and released under the BSD license, meaning that it’s free to use in your personal or commercial projects. See Roundabout In Action Add-Ons Roundabout is equipped to play nicely with a couple of other plugins if they’re made available. Roundabout Shapes by Fred LeBlanc Roundabout can move in more ways than just a turntable. But That’s Not All! The list above is only a list of the plugins that have support baked in, but Roundabout will play nicely with many other plugins. Learn Support New in V2 The code is also a lot cleaner and better commented, which will hopefully allow you to get in there and tweak if you want to. to this: Usage
ajax Description: Perform an asynchronous HTTP (Ajax) request. The $.ajax() function underlies all Ajax requests sent by jQuery. It is often unnecessary to directly call this function, as several higher-level alternatives like $.get() and .load() are available and are easier to use. At its simplest, the $.ajax() function can be called with no arguments: Note: Default settings can be set globally by using the $.ajaxSetup() function. This example, using no options, loads the contents of the current page, but does nothing with the result. The jqXHR Object The jQuery XMLHttpRequest (jqXHR) object returned by $.ajax() as of jQuery 1.5 is a superset of the browser's native XMLHttpRequest object. As of jQuery 1.5.1, the jqXHR object also contains the overrideMimeType() method (it was available in jQuery 1.4.x, as well, but was temporarily removed in jQuery 1.5). Deprecation Notice: The jqXHR.success(), jqXHR.error(), and jqXHR.complete() callbacks are deprecated as of jQuery 1.8. Data Types
Flip Wall Martin Angelov Designing and coding a sponsors page is part of the developer’s life (at least the lucky developer’s life, if it is about a personal site of theirs). It, however, follows different rules than those for the other pages of the site. You have to find a way to fit a lot of information and organize it clearly, so that the emphasis is put on your sponsors, and not on other elements of your design. We are using PHP, CSS and jQuery with the jQuery Flip plug-in, to do just that. Step 1 – XHTML Most of the markup is generated by PHP for each of the sponsors after looping the main $sponsor array. demo.php <div title="Click to flip" class="sponsor"><div class="sponsorFlip"><img alt="More about google" src="img/sponsors/google.png"></div><div class="sponsorData"><div class="sponsorDescription"> The company that redefined web search. The outermost .sponsor div contains two additional div elements. Maybe more interesting is the sponsorData div. Sponsor Flip Wall Step 2 – CSS Step 3 – PHP
Expander In 2010, we released the first version of Wijmo's JavaScript UI Components. At the time, it built on top of the jQuery UI Widget Factory. We had a considerable collection of jQuery Widgets that added much-needed UI options for jQuery developers. We even extended those same widgets to jQuery Mobile when it was released–creating a robust set of mobile-friendly jQuery Widgets. In 2014, we saw a change coming in the JavaScript ecosystem. Our response was to completely rebuild Wijmo in TypeScript and model it more closely to components we developed in C#. Recently, we've added support for the Angular Ivy Compiler and React-Redux.
Google Visualization API―データを操作する - 愚鈍人 本稿ではGoogle Visualization API の英文のドキュメント中にVisualizationと記述されている語をわかり易いようにチャートと呼ぶことにする。 例えばTable visualizationはテーブルチャートと記述する。 チャートだけでなくチャートの基となるデータの操作についてもGoogle Visualization APIは非常に高機能だ。 Google Visualization APIのチャートの基となるデータはDataTableに格納される。 DataTableはリレーショナルデータベースのテーブルと同様に2次元テーブルで表現される。 またチャートの基となるデータには他に、読み込み専用のDataViewがある。 DataTableとDataViewの関係は一般的なリレーショナルデータベースのTableとViewの関係と同じようなものと考えられる。 DataViewは、基となる書き換え可能なDataTableから特定の列や行,フィルタリングされたデータを抽出してつくられた読み込み専用のテーブルということになる。 DataTable DataTableを作成し、データを格納するには2つの方法がある。 DataTableオブジェクトを作成してデータを格納するには以下の例のようにする。 以下のようにオブジェクト作成時に格納するテータも同時に指定する事もできる。 DataTableクラスのコンストラクタの第一引数にテーブルの内容を示すJSONデータを,第2引数にワイヤープロトコルというデータフォーマットのバージョンを示す数値を指定する。 第2引数の値はいまのところ何も考えずに0.6固定にしておけば良いようである。 作成されたテーブルをテーブルチャートに表示するとどちらも以下のようになる。 2つめの方法の方が若干スピードが速くなるが、どちらの方法を使うかはコードの可読性とか他のデメリットも考慮して決めるのが良い。 2つ目の方法で指定したJSONデータは以下に示すDataTableの構成要素の示している。 テーブル DataTableは複数の「列(rows)」と「行(cols)」と「テーブル全体の属性を示すプロパティ(p)」によって構成されている。 これはExcelに代表される表計算ソフトの「シート」と「列」と「行」と「セル」の関係を連想すれば理解しやすい。 列 行 セル プロパティ
data storage JavaScript -> TinySlideshow This file has been reported as broken because: thank you Rate File: 1 Votes (You voted 5) File Name TinySlideshow by Michael Submitted 17 November 2009 - 09:09 PM Last Updated File Type (zip - application/zip) Screenshot Not Available File Size 654.26K (Estimated Download Times) Views Downloads View member's files File Description This Javascript slideshow is feature packed and under 5KB. Estimated Download Times Dialup (56Kbps) 1 minutes 34 seconds DSL (768Kbps) 7 seconds T1 (1.5Mbps) 4 seconds Cable (3Mbps) 2 seconds Fios (10Mbps) 1 seconds Random Files Files Uploaded Today Download Statistics Total Files Total Categories Total Authors Total Downloads Latest File The latest file submitted was TinyDropdown 2 by Michael
Data::Google::Visualization::DataTable Data::Google::Visualization::DataTable - Easily create Google DataTable objects version 0.10 Easily create Google DataTable objects without worrying too much about typed data Google's excellent Visualization suite requires you to format your Javascript data very carefully. This module is attempts to hide the gory details of preparing your data before sending it to a JSON serializer - more specifically, hiding some of the hoops that have to be jump through for making sure your data serializes to the right data types. More about the Google Visualization API. Every effort has been made to keep naming conventions as close as possible to those in the API itself. To use this module, a reasonable knowledge of Perl is assumed. We've tried as far as possible to stay as close as possible to the underlying API, so make sure you've had a good read of: Google Visualization API. Columns Columns are specified using a hashref, and follow exactly the format of the underlying API itself. Rows Cells Properties new
Jquery selectbox advanced jquery UI It depends on jQuery 1.5 and jQuery UI 1.8. The widget is styleable using Themeroller. It works in an unobtrusive fashion, by just turning html multiple select inputs into a sexier equivalent. For installation instructions please have a look at the corresponding blogpost Source code is available at Github In case you are looking for the original version, it has been moved here Features Search within available options, if there are a lots of them Displaying counts of selected and available items Select All / Deselect All Buttons Dragging items from the available list to the selected list directly Contributors Misc There are no limitations. Other active projects