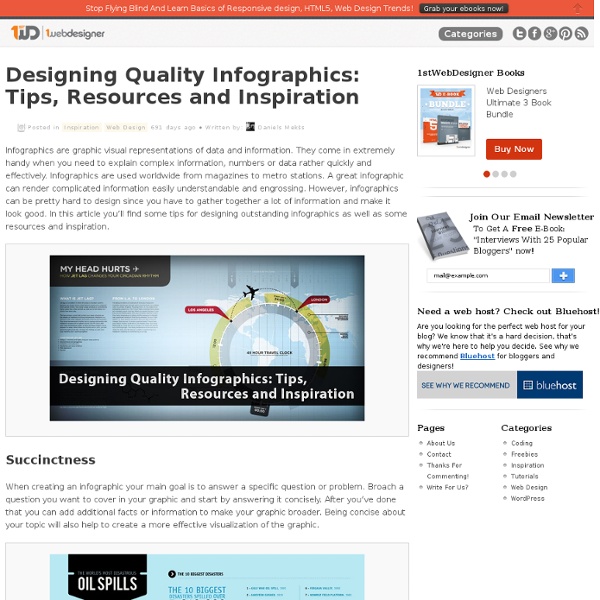
Designing Quality Infographics: Tips, Resources and Inspiration

10 Awesome Free Tools To Make Infographics
Advertisement Who can resist a colourful, thoughtful venn diagram anyway? In terms of blogging success, infographics are far more likely to be shared than your average blog post. Designing An Infographic Some great tips for designing infographics: Keep it simple! Ideas for infographic formats include: Timelines;Flow charts;Annotated maps;Graphs;Venn diagrams;Size comparisons;Showing familiar objects or similar size or value. Here are some great tutorials on infographic creation: Creating Your Infographic Plan and research.If required, use free software to create simple graphs and visualisations of data.Use vector graphic software to bring these visualisations into the one graphic. Ultimately, if you have a little design skill, the very best approach is to create all the simple graphs and illustrations yourself using vector graphic software. Free Online Tools For Creating Infographics Stat Planet Hohli Hohli is an intuitive, simple online chart maker. Creately New York Times Many Eyes Wordle Tableau
Cool Infographics - Blog
How to print large infographics
by admin on Monday, March 7th, 2011 | 1 Comment Let’s pretend you’re either not rich, or don’t feel like spending a ton of money. Who knows, maybe you’re scared of leaving your home, but still want to print this insanely cool infographic you found online. Happened to me today. Then I googled “how to print large infographic”. With this new algo, i’m kinda not suprised the machine isn’t learning well. The thing’s called rasterbator, and claims it will let you print wall size pics if you need. The graphic I found online today was a complete visual of most marketing strategies online, but it was way too big to get a good view of from on it’s own. Here’s a pic of Raseterbator in action:
The Psychology of Color [Infographic] | Louisville Painters
Download the infographic as a PDF Embed this image on your site:
5 Unbeatable Types of Infographic + Free Tools to Create Them
An infographic (information graphic) has been a very effective way to bait for links and social media votes for ages. Like anything else, it can be done right or wrong (I am sure you have seen dozens of poorly implemented infographics by now and maybe a few really good ones). How to create a good one? The secret is in days (maybe months) of brainstorming. A cool concept doesn’t even have to be too very well-designed. All you need is a great idea and some time of putting it together. This post lists 5 unbeatable (when done right) types of infographics as well as free tools to help you put your ideas to life – enjoy! 1. As the periodic table hangs in thousands of classrooms all over the world, it has become a visual metaphor and serves now as a template for knowledge presentation in various niches and verticals. Examples: Tools and resources: 2. Tools and resources: 3. 4. 5. Further reading: Ann Smarty is the blogger and community manager at Internet Marketing Ninjas.
Design a Vintage Typographic Wedding Invitation
Today we’re going to take a step back from the web to embark on a good old fashioned print design project. Wedding invitations have become a major target for home-grown design experiments so we’re going to dive into one and see what we can come up with. We’ll use a major typography focus combined with some simple icons to give the finished product a sophisticated vintage appeal. We’ll also do the whole thing using just two spot colors. Document Setup The first thing that we need to do is set up a document. For the document size, let’s go with a basic five by seven with an eighth inch bleed all the way around. One more thing that I like to do is create a live area guide that serves as a basic visual representation of how close any artwork or type is allowed to come to the edge of the document. To do this, grab the Rectangle Tool and click once on your empty canvas. Once you have the big rectangle on the page, center it with the alignment tools along the top of your document. Date Stamp
How To Create Outstanding Modern Infographics
In this tutorial you will learn that data doesn't have to be boring, it can be beautiful! Learn how to use various graph tools, illustration techniques and typography to make an accurate and inspiring infographic in Adobe Illustrator. Start by using the Rectangle Tool (M) to draw a shape. The entire design is based on a grid of four columns. Condense the shape so it fits within the left-most guide and centre guide. Move the shape over to the right and add another guide to the centre here. Using the Rectangle Tool (M) draw a thin white box on the centre line that will be the width of the gap between the columns. Repeat the process for the other columns with your final result being below. I like to place the most important graphics first and work-in the ancillary charts and graphs afterwards. Early on you can experiment with placing a main graphic that will help give the piece some visual interest. Give the circles a variety of gradients. I'm using a variety of graphs in this infographic.
Color Palette Generator - Colllor
Related:
Related:


