Every death on every road in Great Britain 1999-2010
2 December 2011Last updated at 17:52 The image below shows the location of 2,396,750 road crashes in Great Britain from 1999 to 2010. Each light point is an individual collision which resulted in a casualty. The intensity of brightness shows where collisions are more frequent.
UK riots: every verified incident - interactive map
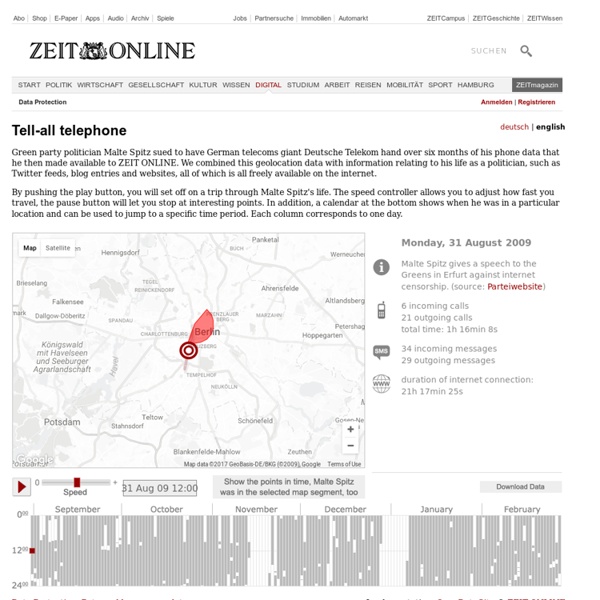
Turn autoplay off Edition: <span><a href="
Temperature Anomalies
Enigma.io is a search engine and API for public data. We find certain datasets to be especially powerful because the underlying phenomena they capture have such a fundamental impact on our world. Climate affects our agricultural production, the price of gasoline, the livelihood of small businesses or temporary farm workers, and ultimately the sustainability of our species on this planet.
Pulse of the Nation: U.S. Mood Throughout the Day inferred from Twitter
Click for high-resolution PDF version (11MB) Video A time-lapse video of the maps, cycled twice, is available below (best viewed at 720p): Mood Variations A number of interesting trends can be observed in the data. First, overall daily variations can be seen (first graph), with the early morning and late evening having the highest level of happy tweets.
Which drug do you take? US and the UK compared by the global drug survey
Which drugs do people take? The Guardian/Mixmag survey is one attempt to explain the facts behind this controversial issue - which sees users claim that more of them use cannabis than energy drinks. Conducted by Global Drug Survey, we wanted to know which drugs people take, how often and why.
Unemployment in America, Mapped Over Time
We often hear about shifting unemployment rate at the national scale. It went up. It went down. It changes month-to-month. But unemployment is very regional, more common in some areas of the country than others.
Urban Population Map
Close Source United Nations, Department of Economic and Social Affairs (UNDESA), Population Division special updated estimates of urban population as of October 2011, consistent with World Population Prospects: The 2010 revision and World Urbanization Prospects: The 2009 revision. Graphic presentation of data based on The Guardian, 27 July 2007.
What's your perfect fitting top, skirt and dress on the highstreet?
Last month, I was browsing the LK Bennett sales, and picked up an indigo pleated skirt in what I vaguely hoped would be the right size. But as I headed for the changing room, I had a feeling it would be too small. And as I struggled with the zip, I raged for the millionth time that a size 10 should be a size 10. As everyone who's ever bought clothes knows, high-street sizing is completely mad. You can easily be a size 8 in one store, and a size 14 in another, and it's impossible to guess your size without lots of zip-wrangling. However, I am a computer programmer as well as a fashion fan, and so I decided to do something about it.
The Refugee Project
Every day, all over the world, ordinary people must flee their homes for fear of death or persecution. Many leave without notice, taking only what they can carry. Many will never return.