
Earprint Productions Meter Obsession by Jason Reinier I have been obsessed with meters, water and gas, for many years. I first noticed meters when I was at Colorado College. When I was a freshman taking an electronic music course, we created “musique concrete” pieces from tape recordings. We went out into the world with just our ears and went on walks, listening to different sounds. Introducing the PivotViewer Control for Silverlight The Silverlight PivotViewer control is now available. Jesse Liberty and I have been working closely with the Live Labs team to help transition the PivotViewer control out as a real product for the developer community. I'm excited to say that the control is no longer a lab project, but is now out and available for developers! My congratulations to the team; they worked really hard to get this control out and into your hands. Of course, it wouldn't be any good to launch a cool control like this without giving you guys everything you need to get started, so let's take a look at what else we put together for you. New Site Content
9 Ways To Deliver An Award Winning Speech Word of mouth marketing can be one of the most powerful marketing tactics. Think about it - it costs nothing and every person who hears about your product is a potential genuine referral. Sometimes you are asked to give business presentations to a group of people interested in your ideas. It can be very difficult to put your ideas into words that your listeners will relate to and appreciate. I have discovered that there is a checklist of guidelines. I need to make sure my listeners are able to follow along with me and capture my enthusiasm as I deliver a speech selling my ideas.
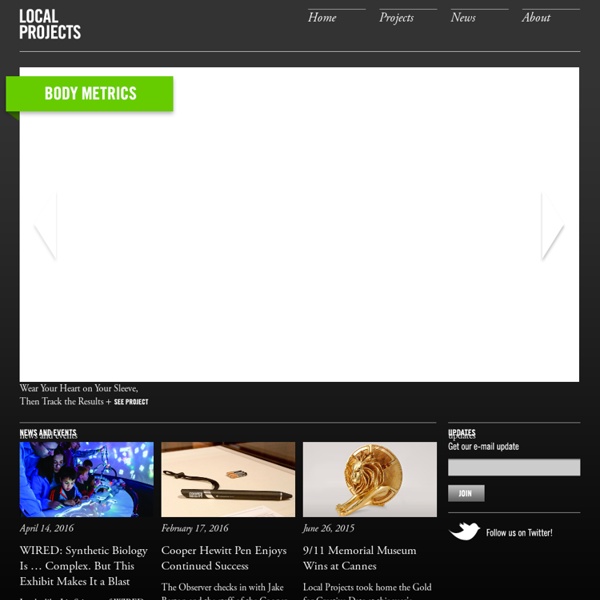
Featured Work Work Featured Work Detail Index Second Story Second Story - Part of SapientNitro Work Landscape Architecture « Jacques Abelman, Celine Baumann (celinebaumann.tumblr.com), YukaYoshida The Wildpoints strategy creates a new form of urban green by actively seeking out new places for nature to colonize the city. The end result of found nature and design interventions adds up to an urban biodiversity network. Discovering Wildpoints Data Visualization: Modern Approaches About The Author Vitaly Friedman loves beautiful content and doesn’t like to give in easily. When he is not writing or speaking at a conference, he’s most probably running … More about Vitaly Friedman …
Yes, That’s a nice Urban Data Visualization. So what? Report of City_Play_Data – Expert Meeting on Digital Media and ‘Ownership’ in the City As you may have noticed, over here at the Mobile City we have recently shifted the focus of our program somewhat. Rather than addressing the role of digital media in cities in general, we decided to focus on a number of issues that we feel are particularly urgent in urban design. One of them we have labeled ‘ownership’. For us ‘ownership’ is about bringing about a sense of engagement with urban life and providing citizens with opportunities to (collaboratively) act. How can we design or employ digital media in such a way that they may contribute to such a sense of ‘ownership’? Using Wireframes to Streamline Your Development Process Creating a wireframe is one of the first steps you should take before designing a website. A wireframe helps you organize and simplify the elements and content within a website and is an essential tool in the development process. A wireframe is basically a visual representation of content layout in a website design. The wireframe acts as a prototype that shows the placement of page features, such as header, footer, content, sidebars, and navigation. It also specifies the placement of the elements within these content areas. If you want to develop a site that accurately matches the client’s requirements and minimize project revisions, wireframing will keep you on track.
50 Great Examples of Data Visualization Wrapping your brain around data online can be challenging, especially when dealing with huge volumes of information. And trying to find related content can also be difficult, depending on what data you’re looking for. But data visualizations can make all of that much easier, allowing you to see the concepts that you’re learning about in a more interesting, and often more useful manner.
Thanks for choosing Tableau Public Your download should begin automatically, but if it doesn’t, click here. Need the 64-bit version? Click here. Just follow these easy steps to install your software: Click the “Run” button to start the process. PivotViewer Control Getting Started Walking Through a Silverlight Application Take a tour of the XAML and Javascript generated by an application template that's installed with the Silverlight SDK. Organizing XAML Assets
37 Data-ish Blogs You Should Know About You might not know it, but there are actually a ton of data and visualization blogs out there. I'm a bit of a feed addict subscribing to just about anything with a chart or a mention of statistics on it (and naturally have to do some feed-cleaning every now and then). In a follow up to my short list last year, here are the data-ish blogs, some old and some new, that continue to post interesting stuff. UNIX / Linux Tutorial for Beginners A beginners guide to the Unix and Linux operating system. Eight simple tutorials which cover the basics of UNIX / Linux commands. Introduction to the UNIX Operating System What is UNIX?