Antarctic Ice Shelf Is A Few Years From Disintegration: NASA
By Alex Dobuzinskis LOS ANGELES (Reuters) - The last intact section of one of Antarctica's mammoth ice shelves is weakening fast and will likely disintegrate completely in the next few years, contributing further to rising sea levels, according to a NASA study released on Thursday. The research focused on a remnant of the so-called Larsen B Ice Shelf, which has existed for at least 10,000 years but partially collapsed in 2002. What is left covers about 625 square miles (1,600 square km), about half the size of Rhode Island. Antarctica has dozens of ice shelves - massive, glacier-fed floating platforms of ice that hang over the sea at the edge of the continent's coast line. The largest is roughly the size of France. Larsen B is located in the Antarctic Peninsula, which extends toward the southern tip of South America and is one of two principal areas of the continent where scientists have documented the thinning of such ice formations. The U.N.
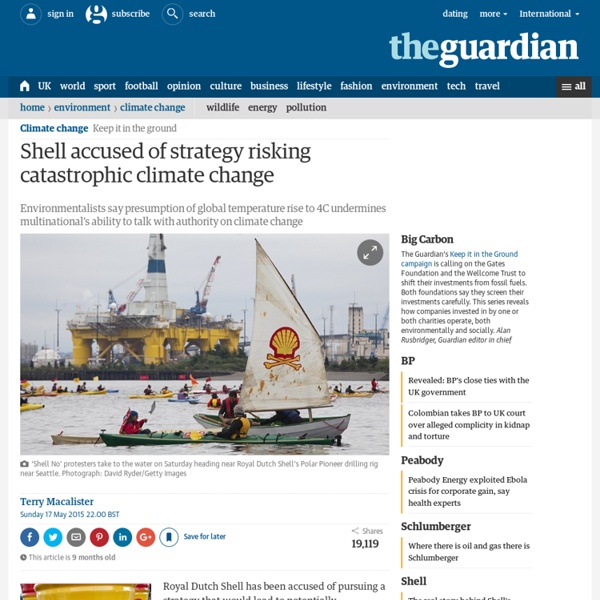
Climate change: Big lifestyle changes are the only answer
Image copyright PA Media The UK government must tell the public small, easy changes will not be enough to tackle climate change, warn experts. Researchers from Imperial College London say we must eat less meat and dairy, swap cars for bikes, take fewer flights, and ditch gas boilers at home. The report, seen by BBC Panorama, has been prepared for the Committee on Climate Change, which advises ministers how to cut the UK's carbon footprint. It says an upheaval in our lifestyles is the only way to meet targets. The government has passed a law obliging the country to cut carbon emissions to net zero by 2050. It is "going further and faster than any other developed nation to protect the planet for future generations", a government spokesperson told BBC Panorama. But the new report warns major shifts in policy across huge areas of government activity are needed to keep the public onside. "Every bit of policy now needs to be refreshed," he warned in an interview with BBC Panorama. Diet Home heating
Thawing permafrost turns Arctic from carbon sink into carbon emitter, study finds
The Arctic is home to vast swathes of permafrost which lock in large amounts of carbon and stop it from being emitted into the atmosphere and contributing to global warming. However, new research shows that a warming climate means permafrost is thawing so quickly the region is now a source – as opposed to a sink – of emissions. In summer, vegetation absorbs carbon dioxide, but this is dwarfed by the amount released during winter. We’ll tell you what’s true. From 15p €0.18 $0.18 USD 0.27 a day, more exclusives, analysis and extras. Scientists estimate 1.7 million metric tons of carbon is released annually by permafrost between October through to April. This is almost twice as high as previous estimates and far exceeds the 1 million metric tonnes of carbon sucked up during the growing season. “We’ve known for a while that thawed soils release carbon dioxide during the summer, but we really didn’t realise how much carbon dioxide is being emitted during the snow-covered winter months.”
Why you should go animal-free: 18 arguments for eating meat debunked | Environment
Whether you are concerned about your health, the environment or animal welfare, scientific evidence is piling up that meat-free diets are best. Millions of people in wealthy nations are already cutting back on animal products. Of course livestock farmers and meat lovers are unsurprisingly fighting back and it can get confusing. Are avocados really worse than beef? What about bee-massacring almond production? The coronavirus pandemic has added another ingredient to that mix. Food is also a vital part of our culture, while the affordability of food is an issue of social justice. First, the over-consumption of meat is causing an epidemic of disease, with about $285bn spent every year around the world treating illness caused by eating red meat alone. So what about all those arguments in favour of meat-eating and against vegan diets? Meaty mattersClaim: Grass-fed beef is low carbon This is true only when compared to intensively-reared beef linked to forest destruction. There’s more. It’s not.
The rich are killing the planet | Chartable
Hi, this is Simon, I am a software engineer at Datawrapper. For this week’s edition of the weekly chart, I took a look at carbon dioxide emissions around the world. The climate crisis is driven by consumption. The more we spend, the more we contribute to global warming. But the truth is much more inconvenient. Different ways to look at the emission curve Two weeks ago, my colleague Gregor made a series of charts that visualize the world’s ever-increasing carbon dioxide emissions: The only chart we should be looking at. The following area chart is taken directly from Gregor’s post. As Gregor pointed out, this partly because western countries have “outsourced” their industrial production to China. This line chart shows emissions per person, while Gregor’s original area chart shows total emissions across regions. Chart choices: Log or linear scales? The scatter plot illustrates the world’s extreme inequality in terms of financial wealth and its correlation with CO2 emissions. 1.