
Archive: Java[tm] Technology Products Download The Oracle Java Archive offers self-service download access to some of our historical Java releases. WARNING: These older versions of the JRE and JDK are provided to help developers debug issues in older systems. They are not updated with the latest security patches and are not recommended for use in production. For production use Oracle recommends downloading the latest JDK and JRE versions and allowing auto-update. Only developers and Enterprise administrators should download these releases. Downloading these releases requires an oracle.com account. For current Java releases, please consult the Oracle Software Download page. Current update releases for JDK 6 and JDK 7 are available for support customers. For more information on the transition of products from the legacy Sun download system to the Oracle Technology Network, visit the SDLC Decommission page announcement. Java SE Java SE 8 Java SE 7 Java SE 6 Java SE 5 Java SE 1.4 Java SE 1.3 Java SE 1.2 Java SE 1.1 JRockit Family Java SE Tutorials
'jstack' - Stack Tracer of JVM Threads 'jstack' - Stack Tracer of JVM Threads "jstack": A JVM troubleshooting tool that prints stack traces of all running threads of a given JVM process, a Java core file, or remote debug server. The "jstack" tool included in the JDK Windows version only supports limited functions as shown the this help message: C:\herong>\Progra~1\java\jdk1.8.0\bin\jstack -help Usage: jstack [-l] <pid> (to connect to running process) Options: -l long listing. Prints additional information about locks -h or -help to print this help message In order to test "jstack", I used this simple Java program, LongSleep.java: When LongSleep.java is running, I used "jps" to get its JVM process ID, pid. C:\herong>\Progra~1\java\jdk1.8.0\bin\javac LongSleep.java C:\herong>\Progra~1\java\jdk1.8.0\bin\java LongSleep Free memory: 4997104 Total memory: 5177344 (Start another command window.) Cool. Table of Contents About This Book Java Tools Terminology Installing Java 8 on Windows 'javac' - The Java Program Compiler Outdated Tutorials
Eclipse Memory Analyzer (MAT) 1. Memory handling in Java Java handles its memory in two areas. Native memory is the memory which is available to a process, e.g. the Java process. The processor (CPU) of the computer computes the instructions to execute and stores its computation results into registers. An operating system (OS) normally uses virtual memory to map the physical memory to memory which each process can see. Current 32-bit systems uses an extension (Physical Address Extension (PAE)) which extends the physical space to 36-bits of the operation system. Of course with a 64-bit OS this 4GB limitation does not exists any more. Java manages the memory for use. In the heap the Java Virtual Machine (JVM) stores all objects created by the Java application, e.g. by using the "new" operator. The memory for new objects is allocated on the heap at run time. Stack is where the method invocations and the local variables are stored. As stated earlier Java objects are created and stored in the heap. 2. 2.2. 2.3. 6. 6.2.
Debug Java applications remotely with Eclipse Remote debugging can be useful for application development, such as developing a program for a low-end machine that cannot host the development platform, or debugging programs on dedicated machines like Web servers, whose services cannot be shut down. Other examples include Java applications running with limited memory or CPU power, such as mobile devices, or developers wanting to separate the application and development environments, etc. Prerequisites If you don't have it already, download Eclipse V3.4 (Ganymede). To use remote debugging, Java Virtual Machine (JVM) V5.0 or later must be used, such as IBM® J9 or Sun Microsystems' Java SE Development Kit (JDK). JPDA introduction Sun Microsystems' Java Platform Debugger Architecture (JPDA) technology is a multitiered architecture that allows you to debug Java applications in all situations easily. The JVM Tool Interface (JVMTI) defines that a VM must provide for debugging. Listing 1. -Xdebug Enables debugging features. transport server address
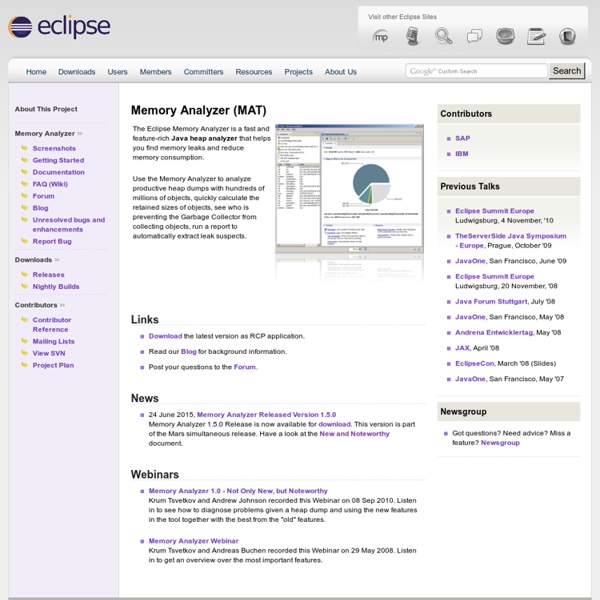
MemoryAnalyzer About The Eclipse Memory Analyzer is a fast and feature-rich heap analyzer that helps you find memory leaks and high memory consumption issues. A summary of the releases is available at MemoryAnalyzer/Releases. Getting Started See the download page for installation instructions. Tutorials View the Webinar recorded on 29 May 2008. See the Eclipse Memory Analyzer Tutorial. Run the leak report to automatically detect memory leaks. Analyze Eclipse: Finding a Leaking Workbench Window. The MemoryAnalyzer/FAQ is under construction, but might help by problems. Concepts Garbage Collection Roots Common GC Roots are objects on the call stack of the current thread (e.g. method parameters and local variables), the thread itself, classes loaded by the system class loader and objects kept alive due to native code. Tasks Getting a Heap Dump HPROF dumps from Sun Virtual Machines The Memory Analyzer can work with HPROF binary formatted heap dumps. Non-interactive Interactive Via MAT: tutorial here Via Java VM parameters:
Monitoring and detecting memory leaks in your java application So your application is running out of memory, you’re spending days and nights analyzing your application hoping to catch the memory holes in your objects. The next steps will explain how to monitor and detect your memory leaks to make sure your app is on the safe side. 1. If you have a suspicion there is a memory leak a convenient way to make sure it’s really there is using jconsole. 2. For this purpose I recommend using jisualVM. this tool is part of the JDK. * Jmap is an oracle tool that prints all objects memory map tree for a given process. So basically you run the jmap on your remote server(for instance your production environment) and then analyze that file locally. 3. I personally like to use MAT(Memory Analyzer) ( Example for a leak detection Here you can see the exact instance which is suspected as a leaking component. 4. Next step is to press on the details field of the suspected instance and investigate the objects inside: 5. Related Whitepaper:
Generating Heap Dump File with 'jmap' Generating Heap Dump File with 'jmap' The second function of the "jmap" tool is to generate a heap dump of a given JVM process with the "jmap -dump:file=<filename>" command: C:\herong>\Progra~1\java\jdk1.8.0\bin\java -Xms24m -Xmx24m GarbageCollection Free/total memory: 23725256 25034752 22710400 25034752 21618728 25034752 20523584 25034752 ... (Start another command window.) C:\herong>\Progra~1\java\jdk1.8.0\bin\jps -l -m 764 GarbageCollection 1204 sun.tools.jps.Jps -l -m C:\herong>\Progra~1\java\jdk1.8.0\bin\jmap -dump:file=GarbageCollection.map 764 Dumping heap to C:\herong\GarbageCollection.map ... So the heap dump file, "GarbageCollection.map", is a snapshot of all heap objects used by the running GarbageCollection.java process. Heap dump files can be browsed by the heap dump browser, "jhat", as described in the next section. Table of Contents About This Book Java Tools Terminology Installing Java 8 on Windows 'javac' - The Java Program Compiler 'java' - The Java Program Launcher References
5 things you didn't know about ... Java performance monitoring, Part 2 Full-featured, built-in profilers like JConsole and VisualVM sometimes cost more than they're worth in performance overhead — particularly in systems running on production hardware. So, in this second article focusing on Java performance monitoring, I'll introduce five command-line profiling tools that enable developers to focus on just one aspect of a running Java process. The JDK includes many command-line utilities that can be used to monitor and manage Java application performance. Although most of them are labeled "experimental" and therefore technically unsupported, they're still useful. Some might even be seed material for special-purpose tools that could be built using JVMTI or JDI (see Resources). 1. jps (sun.tools.jps) Many command-line tools require that you identify the Java process that you want to monitor. The "VMID" identifier is not always the same as the native operating system process identifier ("pid"), which is why we need the JDK's jps utility. Back to top In conclusion
JVM Troubleshooting Tools JVM Troubleshooting Tools This chapter tutorial notes on JVM troubleshooting tools. Topics include 'jinfo' to check JVM option values, 'jstack' to dump stack traces and detect deadlocks, 'jmap' to print heap histogram and dump heap files, 'jhat' to browse head files and run OQL queries. JVM Troubleshooting Tools in JDK 1.5'jinfo' - VM Option Value CheckerChanging HotSpot VM Option using 'jinfo''jstack' - Stack Tracer of JVM ThreadsJava Thread Deadlock Demo ProgramDetecting Java Thread Deadlocks with 'jstack''jmap' - JVM Heap Dump ToolPrinting Histogram of Java Object HeapGenerating Heap Dump File with 'jmap''jhat' - Java Heap Analysis ToolStarting 'jhat' Web Server on a Heap Dump FileListing Instance Counts of All ClassesBrowsing Object Instance ValuesObject Query Language (OQL)Searching for Instances with OQL Statements Conclusions: Table of Contents About This Book Java Tools Terminology Installing Java 8 on Windows 'javac' - The Java Program Compiler 'java' - The Java Program Launcher
Introduction to JMH | Java Performance Tuning Guide by Mikhail Vorontsov JMH is a new microbenchmarking framework (first released late-2013). Its distinctive advantage over other frameworks is that it is developed by the same guys in Oracle who implement the JIT. In particular I want to mention Aleksey Shipilev and his brilliant blog. JMH is likely to be in sync with the latest Oracle JRE changes, which makes its results very reliable. You can find JMH examples here. JMH has only 2 requirements (everything else are recommendations): You need jmh-core maven dependencyYou need to annotate test methods with @GenerateMicroBenchmark annotation This article will give you an overview of basic rules and abilities of JMH. How to run Add the following dependency to your pom file (check the latest jmh-core version at Maven Central): <dependencies><dependency><groupId>org.openjdk.jmh</groupId><artifactId>jmh-core</artifactId><version>0.4.2</version></dependency></dependencies> Create a Java class with a main method. Test modes Time units State housekeeping