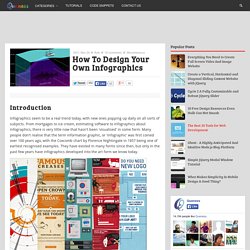

Venn Diagram Maker - Online. How To Design Your Own Infographics. Introduction Infographics seem to be a real trend today, with new ones popping up daily on all sorts of subjects.

From mortgages to ice cream, estimating software to infographics about infographics, there is very little now that hasn't been 'visualised' in some form. Many people don't realise that the term information graphic, or 'infographic' was first coined over 100 years ago, with the Coxcomb chart by Florence Nightingale in 1857 being one of earliest recognised examples. They have existed in many forms since then, but only in the past few years have infographics developed into the art form we know today. However, they suit the information heavy world we live in as they give an easily understandable visual snapshot of something that may otherwise be plain text, and can help to widen the audience of a subject.
But do you have to be a graphic designer to design infographics? Best Practice Process Best Online Resources For Infographic Design Lastly... Looking 4 data visualization: Infographics. .

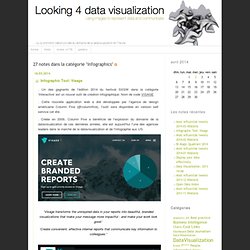
Cool Infographics est le titre d'un livre à paraitre fin Octobre sur le sujet de l'infographie et de la data visualization. Ce livre est présenté comme un guide pour la réalisation d'infographie et de dataviz à destination des départements Marketing pour la publication de contenu web, de rapports annuels ou de présentations. . Son auteur, Randy Krum, est le créateur du blog Cool Infographics qui est rapidement devenu un des sites spécialisés les plus populaires sur le sujet de l'infographie et de la data viusalization. . .
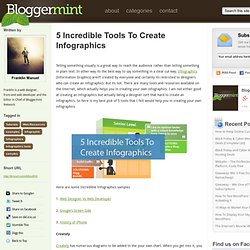
La science de l'infographieLes infographies en ligneInfographies & SEOLes CV en mode infographieInfographies & présentation BusinessTechniques de design (infographie & dataviz)Ressources (Software, Sources de données, etc.) 12 Steps To Creating a Successful Infographic. 5 Incredible Tools To Create Your Own Infographics. Telling something visually is a great way to reach the audience rather than telling something in plain text.

In other way its the best way to say something in a clear cut way. Infographics (Information Graphics) aren’t created by everyone and certainly its restricted to designers who can create an infographics. But its not. There are many tools and resources available on the Internet, which actually helps you in creating your own infographics. I am not either good at creating an infographics but actually being a designer isn’t that hard to create an infographics. Here are some Incredible Infographics samples 1. 2. 3. Creately Creately has numerous diagrams to be added to the your own chart. Google Public Data Unlike the previous tool, Google Public Data isn’t a tool to create infographics but instead the information can be helpful to create an infographics. Tableau Tableau is a Windows based application used for creating great visualizations.
Hohli. How To Create Outstanding Modern Infographics. In this tutorial you will learn that data doesn't have to be boring, it can be beautiful!

Learn how to use various graph tools, illustration techniques and typography to make an accurate and inspiring infographic in Adobe Illustrator. Start by using the Rectangle Tool (M) to draw a shape. Give it a subtle radial gradient too. The entire design is based on a grid of four columns. To make the columns first select the rectangle and drag a guide onto the centre of the shape. Condense the shape so it fits within the left-most guide and centre guide. Move the shape over to the right and add another guide to the centre here. How To Design Your Own Infographics.