
Home Page. Numerical Algorithms Group. IRIS Explorer is NAG's powerful tool for developing customized visualization applications.

Its visual programming environment enables you to develop, prototype and build these applications quickly and easily. Gnuplot homepage. Dataplot Homepage. Protovis. Protovis composes custom views of data with simple marks such as bars and dots.
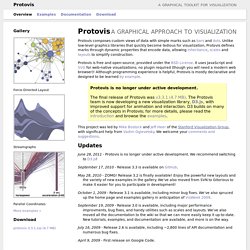
Unlike low-level graphics libraries that quickly become tedious for visualization, Protovis defines marks through dynamic properties that encode data, allowing inheritance, scales and layouts to simplify construction. Protovis is free and open-source, provided under the BSD License. It uses JavaScript and SVG for web-native visualizations; no plugin required (though you will need a modern web browser)!
Although programming experience is helpful, Protovis is mostly declarative and designed to be learned by example. Protovis is no longer under active development.The final release of Protovis was v3.3.1 (4.7 MB). This project was led by Mike Bostock and Jeff Heer of the Stanford Visualization Group, with significant help from Vadim Ogievetsky. Updates. Start [Pajek Wiki] The InfoVis Toolkit. InfoVis CyberInfrastructure- Home.
Interactive information visualization toolkit. Piccolo Home Page. A Structured 2D Graphics Framework Welcome to Piccolo!
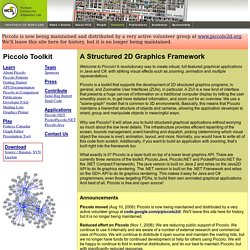
A revolutionary way to create robust, full-featured graphical applications in Java and C#, with striking visual effects such as zooming, animation and multiple representations. Piccolo is a toolkit that supports the development of 2D structured graphics programs, in general, and Zoomable User Interfaces (ZUIs), in particular. A ZUI is a new kind of interface that presents a huge canvas of information on a traditional computer display by letting the user smoothly zoom in, to get more detailed information, and zoom out for an overview.
We use a "scene-graph" model that is common to 3D environments. Why use Piccolo? What exactly is it? Data Visualization for the Web. Axiis : Data Visualization Framework. DocuBurst. Welcome to the DocuBurst website.

As a part of a research project, we are conducting a usability study to investigate how people are using the website. You have been invited to participate in the data logging portion of this study! Please read the consent form below for more details. REB File #:11-102This form has been reviewed by the UOIT REB I hereby consent to participate in a research study conducted by Dr.
I understand that: The purpose of this study is to log user activity for the interest of enhancing the usability of the application and uncovering common user interaction patterns or interests. Jigsaw - Visual Analytics for Investigative Analysis. Summary Investigative analysts and researchers acquire clues and connect small bits of evidence to uncover larger plans, stories, or narratives, and to simply gain a better understanding of the information.

Often, the individual bits of evidence are short text documents or spreadsheets, and analysts must examine large collections of such documents in order to "put the pieces together" and formulate a well-supported hypothesis about actions that may occur in the future. As the number of documents to examine rises, it becomes more and more challenging for analysts to understand the data and make judgments about it. We have created Jigsaw, a visual analytics system to help analysts and researchers better explore, analyze, and make sense of such document collections. Our specific objective is to help analysts reach more timely and accurate understandings of the larger stories and important concepts embedded throughout textual reports. PNNL: IN-SPIRE™ - Home. Walrus - Graph Visualization Tool. Source Code Available The source code to Walrus is now available under the GNU GPL.

You may download the source code below. Description. TreeMap interactive data visualization software v. 3.5.2 released! Treemaps for space-constrained visualization of hierarchies. Started Dec. 26th, 1998 by Later updates by Ben Shneiderman and Catherine Plaisant - Last update Sept 2014 Our treemap products: Treemap 4.0: General treemap tool (Free demo version, plus licensing information for full package) PhotoMesa: Zoomable image library browser (Free demo version, plus licensing information for full package) Treemap Algorithms and Algorithm Animations (Open source Java code) A History of Treemap Research at the During 1990, in response to the common problem of a filled hard disk, I became obsessed with the idea of producing a compact visualization of directory tree structures.
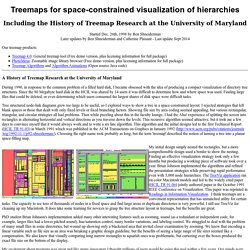
Since the 80 Megabyte hard disk in the HCIL was shared by 14 users it was difficult to determine how and where space was used. Tree structured node-link diagrams grew too large to be useful, so I explored ways to show a tree in a space-constrained layout. My initial design simply nested the rectangles, but a more comprehensible design used a border to show the nesting. Tom Sawyer Software. Thinkmap visualization software facilitates communication, learning, and discovery. Navigator. PNNL: Starlight Visual Information System. Semaspace project homepage. Usage: left mouse button - select node or rotate [l. shift] + mouse move: rotate [l. ctrl] + mouse up / down: zoom (focus on selected node)

NodeXL: Network Overview, Discovery and Exploration for Excel - Home. Netvis Module - Dynamic Visualization of Social Networks. Graphviz - Graph Visualization Software. GUESS: The Graph Exploration System. Cytoscape: An Open Source Platform for Complex Network Analysis and Visualization. XmdvTool Home Page: Overview. News Professor Matthew Ward wins IEEE VPG Award !!!

[Details] Overview XmdvTool is a public-domain software package for the interactive visual exploration of multivariate data sets. Data Visualization Systems: XGOBI and XGVIS, freely available. All active development and support have shifted to ggobi.

In contrast to xgobi, ggobi has richer color support, multiple plotting windows, better portability to Microsoft Windows and MacOSX, support for xml and csv file formats. ggobi has a multidimensional scaling plugin called ggvis, which supersedes xgvis, described below. XGobi A SYSTEM FOR MULTIVARIATE DATA VISUALIZATION XGobi is a data visualization system for viewing high-dimensional data. The authors are Deborah F. Swayne (AT&T Labs), Di Cook (Iowa State University), and Andreas Buja (The Wharton School -- University of Pennsylvania). Visulab. Free Data Visualization Software. Omniscope. Integrates two distinct workspaces in a single, in-memory, file-based application that enables agile, 'best practise' data sharing solutions with end user self-sufficiency spanning the entire workflow; data import, integration, transformation, analysis and presentation/publication:DataManager: data extraction from most sources, transformation, integration and delivery of processed data sets in a wide variety of formatsDataExplorer: interactive visual data discovery & analysis, multi-tan, multi-view reporting/'dashboarding'/publication in a wide variety of formats Users can quickly connect to local, network or online data sources, transform/scrub and integrate the data, then seamlessly create a refreshable, interactive multi-view report, deliverable to recipients in a wide variety of static and interactive formats, most powerful being the via Omniscope free Viewer.
New in Omniscope version 2.8 Download free trial Browse demos & screenshots Watch video tutorials Contact us. Mondrian - Interactive Statistical Graphics in JAVA. GGobi data visualization system. Main. DataGraph is a powerful and easy to use graphing and charting application. NerdGraph - The best infographics blog of the galaxy! Blog About Infographics and Data Visualization - Cool Infographics. Infographic Design Agency – Hire Expert Infographic Designers. THE SEEN - It's Time to Get Visual! Best Infographics - Infographics blog - Infographic finder.
Sprites. Get Started. Visage - Beautiful, Branded Reports. Infogr.am. Orange – Data Mining Fruitful & Fun. Graphi.me. Statista - The Statistics Portal for Market Data, Market Research and Survey Results. Intuitive Data Analysis. Introduction to R, a video series by Google. 50 New Tools Democratizing Data Analysis & Visualization.
Just as we've seen the shift to "DIY" data collection platforms, we're also seeing the development of a whole new class of self-service data exploration and visualization tools. Just as we’ve seen the shift to “DIY” data collection platforms, we’re also seeing the development of a whole new class of self-service data exploration and visualization tools. These are not necessarily replacements for SPSS, SAS, R, and other traditional analytical suites: those enterprise level systems are often still needed to do more complex and advanced statistical analysis. However, in many ways these newer entrants have a leg up over legacy providers: they are less expensive (in many cases free), more flexible, easier to use, and are built with the needs of a variety of users in mind. Today it’s possible to find many tools that can help the most inexperienced user quickly begin doing sophisticated analysis and produce great visualizations from many different types of data.
OfficeReports Second Prism Dapresy. Du jeu de données au jeu avec les données. Vous le savez sûrement, le XXIe siècle est – entre autres – celui de la donnée. A l’heure des metrics en tous genres (pour la collecte), du numérique (pour le stockage et le maniement) et des réseaux (pour le partage et la diffusion), la data est partout, et prend de plus en plus de place dans nos vies. Les partis politiques et grandes entreprises tentent de prévoir le comportement du citoyen lambda à coup de big data, les institutions et les pouvoirs publics tendent doucement vers plus de transparence avec l’open data, n’importe qui peut en apprendre sur lui-même grâce aux nombreuses applications de quantified self qui inondent le marché… et les journalistes, dans tout ça ? Pour ceux dont le métier est de transmettre l’information et d’expliquer le monde, manipuler des tableaux Excel de milliers de lignes et en tirer la substantifique moelle n’est pas la chose la plus simple qui soit.
Les données visualisées peuvent être des images fixes, bien sûr. On se met d’accord sur les termes. Clement Levallois - Teaching and training. This course is offered to Bachelor students from all departments at Erasmus University. An initiative of the Erasmus Studio, it is coordinated by , with and me as co-teachers of three separate modules in it. Franciska de Jong, Renske Jongbloed and Kees Mandemakers also participate in the lectures. The ambition of this course is to provide the students with an in-depth coverage of what "digital scholarship" is today, conceptually and in practice. Stef Scagliola covers the broad panorama of digital scholarship (definitions, concepts, and focus on the digital humanities). Gephi – curated list of tutorials.
Cytoscape: An Open Source Platform for Complex Network Analysis and Visualization. Des logiciels pour l’analyse des réseaux. Getting started with visualization after getting started with visualization. It's easy these days to get started with visualization. There are a lot of resources — books, tutorials, blogs, and classes — to help you learn, and the many new and old software applications let you work with data right away, point and click. You don't have to stop here though. A lot of people do stop at this point. Immersion: a people-centric view of your email life.
Des logiciels pour l’analyse des réseaux. Spot - A Realtime Twitter Visualization. InMaps - Visualize your LinkedIn network. Tag Galaxy. Mentionmapp. 4sqmap - Foursquare Maps and Statistics. OpenHeatMap. Bienvenue! - WorldMap. NodeXL Graph Gallery. Gephi, an open source graph visualization and manipulation software. Processing.org.
Beautiful web-based timeline software. Tagxedo - Word Cloud with Styles. Just Map It! Feeds: lefigaro, lefigaro, lefigaro, lefigaro, lefigaro, lefigaro, lefigaro, lefigaro, lefigaro, lefigaro. Log In. Interactive maps and visualizations. Sparklines for Excel® Online Charts Builder. Text 2 Mind Map - Simple mind mapping online. Create and share visual ideas online. Infographics & Data Visualization. Visualize communities. Create timelines, share them on the web.
A visual exploration on mapping complex networks. Health InfoScape. When you have heartburn, do you also feel nauseous? Or if you're experiencing insomnia, do you tend to put on a few pounds, or more? By combing through 7.2 million of our electronic medical records, we have created a disease network to help illustrate relationships between various conditions and how common those connections are. Take a look by condition or condition category and gender to uncover interesting associations. About this data The information used for this visualization is based on 7.2 million patient records from GE's proprietary database, and represents some of the conditions that commonly affect Americans today. Share Downloads Download Application Design Partner MIT SENSEable City Lab. Many Eyes.
Datavisualization.ch Selected Tools. Looking 4 data visualization. Art and Graphic Design by Alphadesigner.