
הורידו כאן כלים חינמיים ליצירת אינפוגרפיקות. Piktochart - הקטלוג החינוכי. כלי דיגיטלי המאפשר ליצור אינפוגרפיקה - הצגה חזותית של מידע ורעיונות בצורה ברורה ומושכת.

השימוש בכלי אינו מצריך ידע מוקדם בעיצוב. הכלי מאפשר ליצור כרזות, מצגות, פוסטרים ודוחות. העבודה בכלי מתבססת על שימוש בתבניות מוכנות במגוון תחומים אשר נותנות רעיונות לביצוע. כל שנותר הוא לבחור תבנית מתאימה ולהתאים אותה לצרכים. רישום - ניתן להירשם באמצעות חשבון גוגל או פייסבוק או ליצור חשבון באתר ולאשר בדואר האלקטרוני. אוכלוסיית יעד - piktochart מיועד למורים ולתלמידים. שיתוף - הכלי מאפשר שיתוף התוצר לצפייה בלבד.
מערכת הפעלה - windows. שפת ממשק - אנגלית. מגבלות - ניתן לבחור מתוך 32 תבניות, ישנה תוספת של סימן מים בתחתית של האינפוגרפיקה, ניתן לאחסן תמונות עד גודל של 40MB, התמונות מפורסמות באופן ציבורי ולא ניתן לבחור פרסום פרטי. רעיונות לשימוש - במקצוע היסטוריה התלמידים יבחרו סוג משטר ויצרו 2 כרזות אשר יציגו את היתרונות והחסרונות בכל משטר. Infographics Tools for Small Budgets. With an ability to transform tedious text and provide vital visual stimulation, infographics have become an essential part of any Content Marketing Strategy, and with more and more free infographic tools available, anyone can produce something visually attractive.
Infographics are a great way of providing a visual representation of survey results, reviews, how to guides, and much more. Usually designed with attractive colors, trendy typefaces and informal illustrations, infographics can be highly viral content, shared healthfully across social media. Using Infographics to build awareness It has become quite apparent that infographics provide a great way to gain quick exposure of your brand and build authority in your niche.
As a first step to tap into this, you must plan content that can be well represented with statistics and graphs and would be relevant and useful to your readers. "In principle, there's nothing wrong with the concept of an infographic. Graphic Design - Seven Tools for Creating Infographics Without Using Photoshop. How can you create beautiful infographics without using Photoshop?
I'm not a Photoshop expert, so I take days to create a basic infographic. I'm a Paint ninja, but I can't create nice infographics by using Paint. So I searched for fast, easy, and cheap (even free) alternatives. I've outlined the most important aspects of each tool I found: Free version: Is a free version or free trial available? Here's a look at seven tools that can help you with your infographic marketing needs. 1. Free version: free basic version, no trial Restrictions: fewer objects, fewer templates Price and pro functions: $36/year, more templates, access to thousands of images Usability and design: easy-to-use, simple interface Templates: 13 templates Objects: small amount Charts: five different charts Customizability: good.
20 Cool Tools for Creating Infographics. Imagine you are an infographic maker god who can take 1,000 words and help people digest that information in only a few seconds.
An infographic, put simply, is a creative way to take a “thousand words” and depict them using a picture. These days, readers are looking for quick access to brief information. Website visitors love this unique form of presentation which is quickly gaining popularity, and in some cases, becoming the standard form of communication instead of page long, lengthy blog posts. Infographics have emerged as one of the most popular forms of content marketing in contemporary digital media. Why should you care about infographics1 and do I need an infographic maker?
We receive 5 times more information than in 1986 and are 80% more willing to read anything with colors. But readers are not the only ones with time constraints and an inclination towards quick and easy ways to consume information. Forget about Photoshop and other time-consuming infographic maker alternatives. 1. 2. Counter and Clock Infographic Widgets. Did you know that if you placed $400 billion dollars end to end, the bills would cover the same distance as 162 trips from the Earth to the moon?
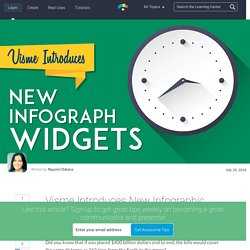
Or that if you ever got your hands on this exorbitant amount of money and decided to count it, you could go through three bills per second and it would still take you 50 lifetimes to do it! Make your data easy to understand and snackable just like this graphic using Visme. These kinds of visual comparisons which use more relatable images and figures to make extraordinary amounts more understandable are commonly used among visualization experts. This is why Visme, an online infographic and presentation tool, offers several infograph widgets that enable users to visualize numerical amounts–whether it be percentages, distance, time or space–using visual comparisons such as units of people, speedometers, timers and digital dials.
(You can also view the video version of this tutorial below.) Applications for New Infograph Widgets 3 Show countdowns. Visual Learning Center by Visme, Infographics & Presentation Resources. Piktochart - הקטלוג החינוכי. Free Infographic Maker. אקד"ם. אינפוגרפיקה בכיתה. Create Easy Infographics, Reports, Presentations.