
Stats Center. InfoFreak. Brazil News. GOOD Magazine. Sputnik Remembered; First Satellite Launched 4 Oct. 1957 - Flock. FluTracker - H1N1 Swine Flu and Influenza Outbreak Tracking from. Cool Infographics - Cool Infographics - The Last 10 Years...Visu. Great chart by Phillip Niemeyer over on NYTimes.com, Picturing the Past 10 Years.
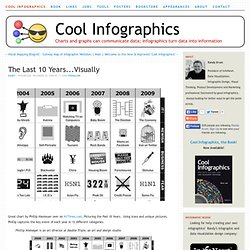
Using icons and unique pictures, Phillip captures the key event of each year in 12 different categories. Phillip Niemeyer is an art director at Double Triple, an art and design studio. Visualizar'09 - Public Data, Data in Public: Projects Overview - The third edition of Visualizar is now finished and the projects developed during the workshop can be visited until the 17th of January in the Medialab Prado in Madrid.
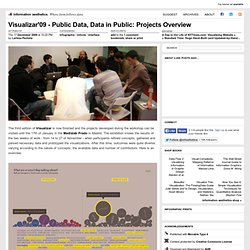
The exhibition shows the results of the two weeks of work - from 14 to 27 of November - when participants refined concepts, gathered and parsed necessary data and prototyped the visualizations. After this time, outcomes were quite diverse, varying according to the nature of concepts, the available data and number of contributors. Here is an overview. The New Political Interfaces [newpoliticalinterfaces.org] aims to visualize the influence of new means of communication in politics. Inspired by the influence of social networking systems in the Obama campaign, the team looked into content generated by official sources and political parties, in contrast to those generated by individuals in online systems. In What do they have? The FLUflux project shows correlations among US international flights and global pandemics. The Great Best of 2009 Recap - Best of 2009 - Lifehacker - Flock.
Infographic Smoke and Mirrors - F. I’ve written previously about my concern that infographics—the mixture of text and images to tell stories, explain concepts, describe processes, or provide instructions—have no real research to back up their claims of effectiveness.
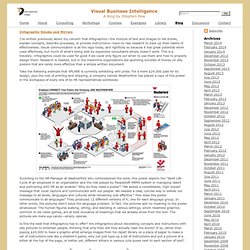
Visual communication is all the rage today, and rightfully so because it has great potential when used effectively, but much of what’s being sold by expensive consultants simply doesn’t work. This is a travesty; infographics could be used for good if we could only figure out when to use them and how to properly design them. Research is needed, but in the meantime organizations are spending bundles of money on silly posters that are rarely more effective than a simple written document. Take the following example that XPLANE is currently exhibiting with pride. Is this the best that infographics has to offer? Infographics can be done well. Once again I’d like to ask you who are infographic experts to prove the worth of your methods. Take care, 50 great examples of infographics - FrancescoMugnai.com - - Floc.
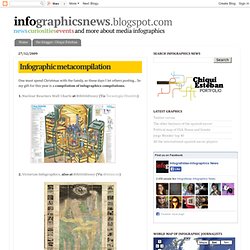
Tube map as an infographic style - Flock. This London Tube map by Harry Beck used form 1933 is considered a great 'hit' of modern infographics.
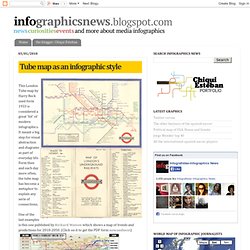
It meant a big step for visual abstraction and diagrams as part of everyday life. Form then and each day more often, the tube map has become a metaphor to explain any serie of connections. One of the last examples is this one published by Richard Watson which shows a map of trends and predictions for 2010-2050. (Click on it to get the PDF form nowandnext) Infographic metacompilation. Infographic metacompilation One must spend Christmas with the family, so these days I let others posting...
So my gift for this year is a compilation of infographics compilations. Infographics « Creative Treatment - Flock. The Sputnik Legacy - Newsweek International - Newsweek.com - Flo. Useful and Creative Global Health Infographics? Mental_floss Blog » 6 Less-Than-Helpful Infographics - Flock. Top 5 Online Resources for the Citizen Journalist - Flock. Over the next few years, those early experiences as well as the investigations that followed led me to accumulate a personal library of valued online resources for journalists.
These are resources that are now extremely valuable to me. They represent the core of my online research, and they are the places I immediately turn to first when it’s time to conduct another deep investigation for another news article. As the Internet expands, the community of citizen journalists continues to grow. Along with that growth comes a sort of collaborative network where you can excel in your research more from networking than you can from competing. Unlike blogging where a lot of the work is private and independent, citizen journalism demands a very wide network of contacts, resources and leads. Top 5 Resources for Citizen Journalists.