

Infographic: Extending the Reach of Excellent Teachers. Infographic: Write It Down. The Cost of Being Iron Man. So here’s a pretty cool infographic for all of you today.
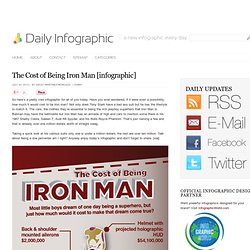
Have you ever wondered, if it were even a possibility, how much it would cost to be iron man? Not only does Tony Stark have a bad ass suit but he has the lifestyle to match it. The cars, the clothes they’re essential to being the rich playboy superhero that Iron Man is. Batman may have the batmobile but Iron Man has an armada of high end cars to mention some there is his 1967 Shelby Cobra, Saleen 7, Audi R8 Spyder, and his Rolls Royce Phantom. That’s just naming a few and that is already over one million dollars worth of straight swag. Taking a quick look at his various suits only one is under a million dollars, the rest are over ten million. Share This Infographic. Thinking about Drinking. Do you know how much you drink?
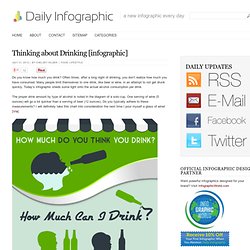
Often times, after a long night of drinking, you don’t realize how much you have consumed. Many people limit themselves to one drink, like beer or wine, in an attempt to not get drunk quickly. Today’s infographic sheds some light onto the actual alcohol consumption per drink. The proper drink amount by type of alcohol is noted in the diagram of a solo cup. iPad Education Dilemma. Technology and education go hand in hand in our modern society.
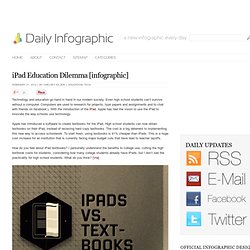
Even high school students can’t survive without a computer. Computers are used to research for projects, type papers and assignments and to chat with friends on facebook;). With the introduction of the iPad, Apple has had the vision to use the iPad to innovate the way schools use technology. Apple has introduced a software to create textbooks for the iPad. High school students can now obtain textbooks on their iPad, instead of recieving hard copy textbooks. How do you feel about iPad textbooks? Share This Infographic. Eight Free tools for Teachers to Make Awesome Infographics. 1- Easel.ly This is a great tool that allows users to create visually rich infographics from pre-designed themes.
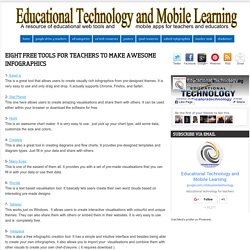
It is very easy to use and only drag and drop. It actually supports Chrome, Firefox, and Safari. 2- Stat Planet This one here allows users to create amazing visualisations and share them with others. It can be used either within your browser or download the software for free. Integrating Infographics into the iClassroom. So TechChef4U has caught the Infographics Influenza!
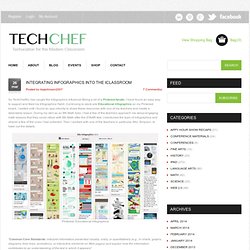
Being a bit of a Pinterest fanatic, I have found an easy way to support and feed my Infographics Habit. Continuing to stock pile Educational Infographics on my Pinterest board, I waited until I found an app-ortunity to share these resources with one of my teachers and create a delectable lesson. During my stint as an 8th Math tutor, I had a few of the teachers approach me about engaging math lessons that they could utilize with 8th Math after the STAAR test. Untitled Document. Venngage. The Best Resources For Creating Infographics. What About Me? 13 Fantastic and Fun Image Generators.
Infographics in Education - Project Requirements. Good Information by Janet Sauber 5 Components of a GOOD Infographic!
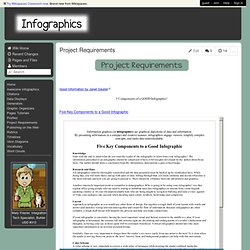
Students LOVE choice! Let's admit it, we ALL love choice! Checklist. Infographics at School. I have posted before about how much I love infographics.
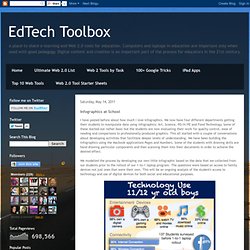
We now have four different departments getting their students to manipulate data using infographics: Art, Science, PD/H/PE and Food Technology. Some of these started out rather basic but the students are now evaluating their work for quality control, ease of reading and comparisons to professionally produced graphics. This all started with a couple of conversations about developing activities that facilitate deeper levels of understanding. We have been building the infographics using the Macbook applications Pages and Numbers. Some of the students with drawing skills are hand drawing particular components and then scanning them into their documents in order to achieve the desired effect.
We modelled the process by developing our own little infographic based on the data that we collected from our students prior to the rollout of our 1-to-1 laptop program. Related Articles. InfoGraphic Designs: Overview, Examples and Best Practices. Information graphics or infographics are visual representations of information, data or knowledge.
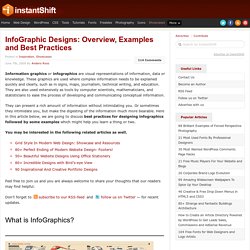
These graphics are used where complex information needs to be explained quickly and clearly, such as in signs, maps, journalism, technical writing, and education. They are also used extensively as tools by computer scientists, mathematicians, and statisticians to ease the process of developing and communicating conceptual information. They can present a rich amount of information without intimidating you. Or sometimes they intimidate you, but make the digesting of the information much more bearable.
Here in this article below, we are going to discuss best practices for designing infographics followed by some examples which might help you learn a thing or two. You may be interested in the following related articles as well. A Few Rules for Making Homemade Infographics. Like many other fans of infographics, we were excited about today's launch of Visual.ly, a site that helps normal folk create infographics.
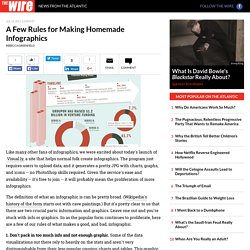
The program just requires users to upload data, and it generates a pretty JPG with charts, graphs, and icons -- no PhotoShop skills required. Given the service's ease and availability -- it's free to join -- it will probably mean the proliferation of more infographics. The definition of what an infographic is can be pretty broad. Infographics_ISTE.pdf (application/pdf Object)