
Ig_Milestones-in-Creative6_web5-copy.png 700×10,224 pixels. Presentations: How to Make Your Message Stick. I’d guess that most of you that are reading this have either given PowerPoint presentations at one time or another or at least viewed one.

Did you know that statistics reveals that listeners only remember 50% of what was presented just 10 minutes after a presentation is given? The following day, it drops to 25%. A week later, it whittles down to just 10%. And this is if your presentation is good. With over 350 PowerPoint presentations given each second across the globe, how does one go about making theirs stand out from all the others? The Digital Marketing Trio Of 2013 [Infographic] Digital marketing as a whole has become one of the biggest and most focused on streams of marketing in the last few years.
![The Digital Marketing Trio Of 2013 [Infographic]](http://cdn.pearltrees.com/s/pic/th/digital-marketing-infographic-59185797)
Businesses of all sizes are finally catching on that if their marketing efforts are going to be successful, they need to have a strong digital arm. 3 of the biggest digital marketing streams today include social network marketing, mobile, SMS marketing, and content marketing. Here’s a brief look at each… Baseball Stats and Fun Facts You May Not Know [Infographic] Banking on Education.
The Analytic Big Bang Infographic. Infographic: Top digital marketing trends of 2013. Content marketing is among the top four digital market trends this year, according to a recent infographic from Dot Com Infoway.

Along with content marketing, mobile marketing, social media and author rank make up the other leading trends. Author rank, for those who don't know, is based on the level of engagement an author has achieved online through various social media channels and content posting. When it comes to content marketing, the infographic gets a bit meta. It says that content marketing will make up nearly 33 percent of the marketing budget this year, compared to 26 percent last year. It also says infographics provide a 25 percent increase in average website traffic. INFOGRAPHIC: Global refugee situation. Top Dangers of the Digital Age (Infographic) The internet brought us LOLcats, memes and social media.

But it’s not all fun and games. If you were looking for a hearty list inspired by the internet’s dark side, here it is. Especially for children, digital space can be tricky. Check out the top online threats, and how to avoid them. Do You Reveal Too Much About Yourself On Social Media? [INFOGRAPHIC] How to Make Coffee and Share Fun Coffee Tips Like a Pro.
Like a good friend, a good cup of coffee comforts us, makes things feel right and sparks beautiful ideas.

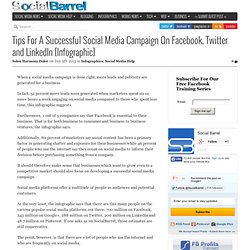
Store on fun facts, helpful hints and fascinating frugal clues from this infographic which spreads information and inspiration perfect for your second cup. Learn how to prepare the world’s best loved coffee blends like a pro to serving the perfect coffee nibblers that goes with what flavor. Tips For A Successful Social Media Campaign On Facebook, Twitter and LinkedIn. When a social media campaign is done right, more leads and publicity are generated for a business.

In fact, 52 percent more leads were generated when marketers spent six or more hours a week engaging on social media compared to those who spent less time, this infographic suggests. Furthermore, 1 out of 3 companies say that Facebook is essential to their business. That is for both business to consumer and business to business ventures, the infographic says. Additionally, 80 percent of marketers say social content has been a primary factor in generating chatter and exposure for their businesses while 46 percent of people who use the internet say they count on social media to inform their decision before purchasing something from a company. Highest paid and fastest growing IT jobs [infographic] Not exactly the “pure” mobile news, but related nonetheless since everything related to mobile is well paid these days.
In a new infographic, Staff.com looks at highest paid and fastest growing IT jobs – here are the highlights: Mobile application development is the hottest area in IT as there are more jobs than there are skilled people to fill them. In 2012, job postings on Dice.com went up by 129% for Android developers and 190% for iPhone developers.
Of all IT jobs, mobile application developer is most paid with an average salary of $94k. Moreover, this is also the fastest growing job position. And here’s the infographic with few additional details… About The Author. The Psychology of Conversions [INFOGRAPHIC] The amount of emphasis put on leads these days is staggering.
![The Psychology of Conversions [INFOGRAPHIC]](http://cdn.pearltrees.com/s/pic/th/conversions-infographic-248122238)
Sales is constantly demanding more, marketers are always trying new ways to find them, and a large part of marketing success is tied to the number of leads generated. This quest for more leads is what drives companies to implement exciting new technology like marketing automation: to capitalize on lead nurturing, streamline processes with lead scoring and grading, and utilize advanced reporting to perfect their marketing campaigns.
There is however, another change marketers can make to generate results that isn? T tied to technology at all: understanding the psychology of conversions. The decision making process follows a relatively predictable pattern, with triggers that influence and guide consumer behavior. Original.jpg 2,500×3,500 pixels. How_to_control_your_dreams.jpg 970×8,200 pixels. Say-what-you-mean.jpg 768×5,417 pixels. Analytics Driving Digital Marketing. It’s been said that in the world of mobile marketing, there are three little letters more intimidating than IRS and as frightening as STD. I’m referring, of course, to ROI. For many new entrants into the mobile marketing fray, attempting to understand one’s ROI can be a confusing and frustrating exercise.
“The most significant issue for ad buyers,” reads a new report from MIT Technology Review , “is that they don’t know if the ads are working, like they do on desktop computers.” The report cites data from the Interactive Advertising Bureau, which indicates that all media depend critically upon reliable metrics for audience reach. “Especially with limited screen size, and much shorter time for placements, mobile advertisers have to be much more focused, more targeted,” advises Peter Wang, senior vice president of engineering at appssavvy .
In fact, analytics capabilities have never been more important than they are today. The rise of forensic accounting [infographic. How to Get More Likes on Facebook - Infographic. In this infographic we look into what creates the most engagement on Facebook.

Please feel free to leave your thoughts in the comments section at the bottom of the page. Click on the infographic below to view a larger version: View an enlarged version of this infographic » AAFPINS_FamilyDoctor-2.jpg 640×3,454 pixels. Hair. Infographic: evolution of the airline logo. Cutting a path through the clouds, heading to some far-flung destination; or working through the night to connect national and international business; the way we perceive airlines has barely changed in the past 50 years. And that perception — one of glamour, efficiency, and professionalism — is almost entirely due to clever advertising and careful branding. The actual experience of travelling by air is, in reality, one of queues, delays, lost baggage, high-cost and ever decreasing leg room. But we forget all that when we see the proud colors of our nations’ flag emblazoned across the tail of an aircraft.
As the reaction to American Airlines’ rebranding proves, we expect a certain heritage to be present in our airline branding. As this infographic shows, national identity, speed and history, coupled with the tail fin of a plane all combine to keep us flying. Produced by JustTheFlight.co.uk. Truth-hurts-infographic.jpg 950×9,794 pixels. [Infographic] Google's 200 Ranking Factors. There’s no doubt that Google’s algorithm is more complex — and volatile — than ever.
![[Infographic] Google's 200 Ranking Factors](http://cdn.pearltrees.com/s/pic/th/infographic-ranking-factors-58784268)
The days where SEO was all about meta tags and backlinks is long gone. Google now uses at least 200 ranking factors in their algorithm, including social signals, user-interaction signals, and trust. If you’d like a bird’s eye view of these factors, then this infographic by Entrepreneur.com and Backlinko may give you some much needed perspective. The piece covers all of the known 200 ranking signals that Google uses to rank sites and pages. However, it’s important to note that many of these aren’t proven or official ranking signals. Infographic: Content Marketing Sweetens the Mix. May 31, 2013 There's no perfect recipe for whipping up the ideal marketing mix, but brands and agencies agree that content marketing is an essential ingredient.
According to a survey by global newspaper website MailOnline , 66% of brands and 65% of agencies think that branded content marketing has become “very important” or “most important” to their overall mix. In addition, 70% of brands and 77% of agencies say they've applied branded content marketing for advertising purposes within the past year. Eye-Opening Social Media Marketing Statistics 2013 [Infographic]
1 in Share in Share 1 Social Media Marketing is enjoying its golden days as 36 percent of marketers have found their customers via Twitter. Surprisingly, according to Social Media Marketing Statistics 2013 Companies are growing themselves on social media depending on their followers on Twitter as companies with more than 1000 Twitter followers generate an average of 800 new website visitors each month. U.S. users are winning as 27% of total U.S. internet time is spending on social networking sites. In past 6 years marketers have understood the real importance of marketing on social media as social media produces have almost doubled the marketing leads.
This latest statistics has revealed that 52% of marketers have found a customer via Facebook and 43% via LinkedIn. A guide to marketing genius: Content marketing [infographic. The Advanced No-Gym Bodyweight Workout (INFOGRAPHIC) By Jordan Shakeshaft Think bodyweight training can't get intense?

Our favorite no-equipment moves are getting a whole lot more kick-ass -- from head to toe. Designed by Greatist Expert and trainer Jonathan Angelilli, this advanced bodyweight workout stacks exercises in back-to-back circuits to keep the heart rate up while building strength and speed. From handstand push-ups to single-leg planks, 30 minutes is all it takes to put the mind and body to the test -- no heavy weights or machines necessary. More from Greatist:The 30-Minute Beginner Bodyweight Workout [Infographic]87 Cheap and Healthy Lunch and Dinner RecipesRecipe: Cauliflower Crust Pizza Before performing any of the advanced bodyweight moves below, Angelilli recommends having a foundation of at least one year of strength training under your belt (on top of being healthy and injury-free, of course).
Unfamiliar with any exercises illustrated below? State Stress Levels: The Most-Stressed U.S. States And Cities (INFOGRAPHIC) If you need to de-stress, you could add some cardio , try meditation — or move to Hawaii. No surprise, that's the least stressful place in the U.S. to live, according to a Gallup-Healthways survey on daily stress levels released last month. How To Avoid A Fight With Penguin. Infographicstestsearchenginejournal_4e60d965cbacf.jpg 1,200×2,320 pixels. PH23567-INFO 473×2,700 pixels. Infographic: Tennessee wins solar jobs "smackdown" over Alabama. View full size Solar panels on the roof of Alabama Power's downtown headquarters in Birmingham A few weeks ago, the Maryland based Renewable Energy Corporation (REC) produced a provocative infographic called the "Solar Jobs Smackdown” highlighting the differences in solar energy policies between Maryland and Virginia .
On behalf of the Green Register, REC produced a new solar jobs infographic between rival states Tennessee and Alabama. The difference in the number of solar jobs and companies between the two states was surprising. Tips & Resources - Network Security, Web Security. How to Survive Hurricane Season - A Preparedness Infographic. The-New-Face-of-SEO-Post-Panda-Penguin2.jpg 540×6,803 pixels. Infographic: “Weddings Around The World. The anatomy of the hourly workforce [infographic. State-of-Single-Parenthood.png 1,754×13,888 pixels. Medicare Insurance ResourcesMedicare Insurance Resources. Infographic: Takes more than responsive web design to keep visitors engaged. When it comes to delivering a mobile web experience, it takes more than simply using all the right tools to deliver an optimal one because speed counts in a big way. In fact, as this infographic illustrates, mobile users are a mighty impatient bunch.
How impatient? Well, 40 percent will leave if a mobile website doesn't load in just 3 seconds and 80 percent won't come back if they have a bad experience accessing your website. All Aboard the Broadband Wagon. All Aboard the Broadband Wagon It’s nearly impossible to imagine a world, sans “wide web.” Which Public Cloud Do You Intend To Use For App Hosting? Funny Infographic Shows People How To Choose Their Next Facebook Profile Picture.
One of the hardest decisions people have to face in life is choosing what will be their next profile picture on Facebook. Kidding aside, everyone who is one Facebook has faced this question. However, with all the no-nos which have evolved from our own societies and their ever changing standards, this profile picture question definitely has become a bit harder to answer these days. Thankfully, we have help in the form of an infographic made by Photoworld . Let’s dive into one of the scenarios. Infographic: The cost of motoring around the world. If you think owning a car in the US is expensive, put an eye on this inforgraphic. The team from Prestige Performance Center GB took a look at all the costs associated with owning a car in multiple countries from around the world, and the results are eye-opening. For example, the average cost of a new car is $105,253 in Singapore , though that country is an outlier.
It will cost you an average of $30,500 to bring home a new set of keys in the US. Turkey, meanwhile, suffers through the highest average yearly cost for fuel at just under $5,000. Social on smartphones [infographic] _infographic_social_media_shortcuts.jpg 800×3,963 pixels. Your Complete Guide To White Wine [Infographic]
Smartphone figures, behavior and more [infographic] The Role of “Social” in Business [Infographic] U.S. Entrepreneurship Climbs to Highest Level in More Than a Decade (Infographic) How to optimize photos for Facebook's News Feed. Tornadoes. Memorial Day 2013 Infographic! Memorial Day Infographic. Infographic: Four Distracted Driving Myths. Infographic: Texas has had a more dramatic shift to the GOP than any other state over past 20 years. Raise Your Cloud IQ. INFOGRAPHIC: Which causes do most nonprofits serve?
What a Real Relationship in Social Media Should Look Like [INFOGRAPHIC] Google-fibre1-2.jpg 970×6,292 pixels. Soccer 101: All the Footy Facts! [Infographic] The facts about mobile phone theft. Infographic: What you need to know about LTE wireless. How to Become a Social Media Marketing Expert – Infographic. Social Media & Travel Brands. How 'Star Trek' Technology Works (Infographic) Schooled by Google: How Google Apps is penetrating education (infographic) Music's Effect on Learning. The Internship: Apprenticeships to Virtual Work [INFOGRAPHIC] Celebrate Stephen Colbert’s 49th Birthday With Some Fun Facts [INFOGRAPHIC] Green Transportation: Your Best Choices [Infographic] Fatigue causes more accidents than alcohol: INFOGRAPHIC.
United States Marijuana Arrest Information. Psychology of a Happier Home Infographic. Infographic: Here Comes the Tech-Savvy Bride. Infographic: The Cost of Losing Your Smartphone. 18 Sweet Tips For Facebook Page Posts. Greenest Ways to Get Around [Infographic] Twitter Engagement Cheat Sheet. What You Should Post On Facebook. First Dates Across America (Infographic) Cannabis VS Alcohol. Five tips for creating a great infographic for SEO. How-Graph-Search-Affects-Your-Privacy11.png 700×2,189 pixels.
Best Times to Post on Social Media [INFOGRAPHIC] Summer Travel Infographic: Scenic Highways And Byways. Infographic: Massively Massive Data Centers Being Massive. Your Dream Green Home: 13 Elements [Infographic] San Francisco, Seattle and Portland Top Chart of Leading Cities for Female Entrepreneurs. Fruit-For-Health_Infographic.