
3 Free Tools for Creating Your Own Infographics. One way to communicate a large sum of data and information is to create an infographic -- a visual representation of a group of data points.
Because they're composed of images, you can see the information at a glance. In business, they're commonly used to share information collected in a survey but they have many other uses. Business owners can use an infographic to compare products, map sales or simply entertain your customers. You can use them to show work-flow, financial data or explain employee bonuses -- it's limited only by your imagination. But without serious graphic skills, isn't creating an infographic a lot of work? Related: 3 Low-Cost Tools for Better Virtual Meetings 1. 2. 3. Upload your own graphics, clone and position graphics with a single touch, use the grid for a perfect layout and change the color of any item on the page. Related: Beyond Pinterest: 3 Emerging Social Photo-Sharing Sites for Business Cynthia Boris is a freelance writer based in Orange County, Calif.
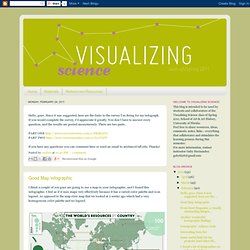
Best Infographics, Cool Infographics, Submit Infographics. Infographic: The Credit Score Report. Add this Infographic to Your Website: Simply copy the code below and paste it into the HTML of your blog, website, or Static FBML box on Facebook <div align="center"><a href=" target="_blank"><img src=" alt="infographic" width="430"><br />Click to Enlarge</a><br /> Via <a href=" New American Funding </a><br />View Other <a href=" This infographic was submitted to us by the folks at New American Funding. They provided this introduction: “Over the past few weeks we have been taking a long, hard look at credit scores.
Do Americans understand what goes into a credit score? There is some interesting data packed into this infographic. This infographic has a really great color scheme. Although a little bit shorter than I prefer, I would still give this infographic an A. February 2011. Hello!
We are in the second week after the presentation of Project 1, and we need to move fast to define everything related to it, because Spring Break is coming soon. These are the activities for the following days: 02.21.11: Quick presentation of topic. Golden Section Graphics. Infographic Design. Infographics news. Infographic of Infographics - IVAN CASH - ARTIST / DESIGNER / ART DIRECTOR. Infographic of Infographics This project is pretty self-explanatory...
Since creating this infographic back in 2011, it has become the #1 Google Image result when you search "infographic" and I've therefore received a lot of inquiries about the project, to which my replies are below: • While flattered by all the inquiries, I am by no means a professional infographic designer and so I kindly ask that you not contact me for infographic-related jobs. • You are absolutely welcome to purchase an 'Infographic of Infographics' print here: Source: Infographic Design. Songs To Live Life By. Queen’s ‘Bohemian Rhapsody‘ might be your favorite song to rock in the car, but what about when you get to your hot date?
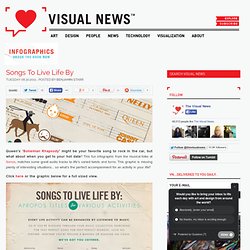
This fun infographic from the musical folks at Sonos, matches some great audio tracks to life’s varied twists and turns. This graphic is missing plenty of interesting situations… so what’s the perfect accompaniment for an activity in your life? Click here or the graphic below for a full sized view. Known in some circles as the most amazing man in the universe, he once saved an entire family of muskrats from a sinking, fire engulfed steamboat while recovering from two broken arms relating to a botched no-chute wingsuit landing in North Korea. When not impressing people with his humbling humility, he can be found freelance writing, finding shiny objects on the internet, enjoying the company of much-appreciated friends and living out his nomadic nature.