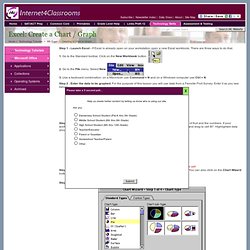

Excel Charts and Graphs Tutorial - How to Make and Create, MS 2007 Excel 2010. Using Excel to Create a Chart or Graph at Internet 4 Classrooms. Step 1 - Launch Excel - If Excel is already open on your workstation open a new Excel workbook, There are three ways to do that. 1.

Go to the Standard toolbar. Click on the New Workbook button. 2. Go to the File menu. Select New. 3. Use a keyboard combination: on a Macintosh use Command + N and on a Windows computer use Ctrl + N Step 2 - Enter the data to be graphed. Bitstrips tutorial 1 introduction.