
Io statistics per process linux. Newer Linux kernels have per-process I/O accounting and you can use the iotop tool to find out what’s performing I/O, but in many cases I’m trying to find the source of an I/O problem in an older kernel.

I found sort of a hack-ish way to do that today, while trying to figure out why a system was basically unresponsive. I found a post on Stack Overflow that showed a way you can get per process I/O statistics from the kernel even in older kernels. I adapted this to my needs, and wrote a little script. Here’s how you use it. First, get it: wget Then turn on kernel messages about I/O: echo 1 > /proc/sys/vm/block_dump This makes the kernel start writing messages about every I/O operation that takes place. While true; do sleep 1; dmesg -c; done | perl iodump Wait a little while, then cancel the script. Root@kanga:~# while true; do sleep 1; dmesg -c; done | perl iodump ^C# Caught SIGINT. Monit. Bandwidth Monitoring Tools for Ubuntu Users. If you're new here, you may want to subscribe to my RSS feed and if you have questions related to your ubuntu system post question to our forums.

Thanks for visiting! Sponsored Link Bandwidth in computer networking refers to the data rate supported by a network connection or interface. One most commonly expresses bandwidth in terms of bits per second (bps). The term comes from the field of electrical engineering, where bandwidth represents the total distance or range between the highest and lowest signals on the communication channel (band).
Bandwidth represents the capacity of the connection. Here is the list of bandwidth monitoring tools for your network bandwidth bmon bwbar bwm bwm-ng iftop iperf ipfm speedometer cbm ibmonitor pktstat mactrack MRTG Cacti Now we will see each tool separately bmon bmon is a portable bandwidth monitor and rate estimator running on various operating systems. Current Stable Version :- 2.1.0 Install bmon in Ubuntu. 10 Tips for Optimizing MySQL Queries (That don’t suck)
Justin Silverton at Jaslabs has a supposed list of 10 tips for optimizing MySQL queries.

I couldn't read this and let it stand because this list is really, really bad. Some guy named Mike noted this, too. So in this entry I'll do two things: first, I'll explain why his list is bad; second, I'll present my own list which, hopefully, is much better. Onward, intrepid readers! Java theory and practice: Instrumenting applications with JMX. How many times have you looked at a running application and wondered "What the heck is it doing, and why is it taking so long?

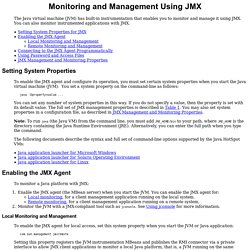
" In these moments, you probably wish you had built more monitoring capabilities into your application. For example, in a server application, you might be interested in viewing the number and types of tasks queued for processing, the tasks currently in progress, throughput statistics over the past minute or hour, average task processing time, and so on. These statistics are easy to gather, but without an unintrusive means of retrieving the data when it is needed, they are not very useful. Platform Monitoring and Management Using JMX. The Java virtual machine (JVM) has built-in instrumentation that enables you to monitor and manage it using JMX.

You can also monitor instrumented applications with JMX. Setting System Properties To enable the JMX agent and configure its operation, you must set certain system properties when you start the Java virtual machine (JVM). You set a system property on the command-line as follows: java -Dproperty=value ... You can set any number of system properties in this way.
Note: To run java (the Java VM) from the command line, you must add JRE_HOME/bin to your path, where JRE_HOME is the directory containing the Java Runtime Environment (JRE). The following documents describe the syntax and full set of command-line options supported by the Java HotSpot VMs: Enabling the JMX Agent To monitor a Java platform with JMX: Enable the JMX agent (the MBean server) when you start the JVM. Local Monitoring and Management com.sun.management.jmxremote. Contents. Java Management Extensions. JMX 1.0, 1.1 and 1.2 were defined by JSR 003[1] of the Java Community Process. As of 2006[update], JMX 2.0 is being developed under JSR 255.[2] The JMX Remote API 1.0 for remote management and monitoring is specified by JSR 160.[3] An extension of the JMX Remote API for Web Services is being developed under JSR 262.[4] Adopted early on by the J2EE community, JMX has been a part of J2SE since version 5.0.
It is a trademark of Oracle Corporation. Architecture[edit] JMX architecture JMX uses a 3-level architecture: Applications can be generic consoles (such as JConsole[5] and MC4J[6]) or domain-specific (monitoring) applications. Protocol adapters provide a management view of the JMX agent through a given protocol. Managed Bean[edit] A managed bean - sometimes simply referred to as an MBean - is a type of JavaBean, created with dependency injection.