
Profilers. Linux systems count with a wide variety of profilers each of with their pros and cons, there is no magic bullet, it's recommended to use more than one tool when analyzing your application, I recommend you to use at least OProfile and Valgrind.
OProfile OProfile is a non-obtrusive system-wide profiler for Linux, it can use system's performance counters to give you insights on where to optimize your code. Helper script for simple runs (remember to run opcontrol --setup ... once before this script): #! /bin/sh sudo opcontrol --init sudo opcontrol --start sudo opcontrol --dump sudo opcontrol --reset $@ sudo opcontrol --stop opreport --symbols > oprof.txt see also oprof_start User Interfaces oprof_start Qt3 GUI for OProfile, ships in official distribution, see KCachegrind One can use reports that are usable by kcachegrind with (for more instruction see opreport -gdf | op2callgrind OProfileUI Documentation In depth explanation can be found at: Caveats GProf KProf Outdated, but exists: How profilers lie: the cases of gprof and KCachegrind. We'll see how gprof and KCachegrind lie to us and why they do so, discuss the limits within which we can trust them nonetheless, and attempt to draw more general conclusions about profilers and profile visualization tools.
(In case your programming vocabulary is different from mine - I use "lying" in its dispassionate meaning of "communicating falsehoods" and not to convey negative judgement; on the contrary, I'm indebted to the authors of profiling tools both as a user and a developer of such tools.) So, consider a program with two parts - an easy part and a hard part. Both parts do similar work but one part does much more work than the other: void work(int n) { volatile int i=0; //don't optimize away while(i++ < n); } void easy() { work(1000); } void hard() { work(1000*1000*1000); } int main() { easy(); hard(); } Here, work() is a do-nothing loop. easy() executes a thousand iterations of that loop and hard() executes a billion iterations. Now let's profile the program with gprof: GNU gprof. Profiling with GProf. (written by Steve Wolfman) Gprof is a profiling program which collects and arranges statistics on your programs.Basically, it looks into each of your functions and inserts code at the head and tail of each one to collect timing information (actually, I don't believe it checks each time the function is run, but rather collects statistically significant samples).
Then, when you run your program normally (that means with any std and file i/o you would normally have), it creates "gmon.out"... raw data which the gprof program turns into profiling statistics (which tell you all sorts of neat stuff). Get your program working!! Gprof is not a debugger. Ignore internal_mcount!!!!! Leave out the -g option and maybe even include the -O (or -O2 or -O3) option in your compilation.
Optimize the big time-suckers and the high frequency called functions first! Check out the -D option in man gprof. If gprof left wierd looking nasty function names in your results, use "c++filt". C++filt __vc__11SymbolTablei. QProf Qt. Gprof2Dot - jrfonseca - Convert profiling output to a dot graph. - José Fonseca's utilitities. This is a Python script to convert the output from many profilers into a dot graph.
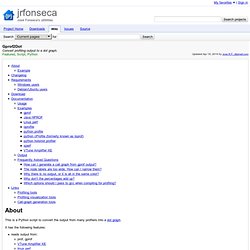
It has the following features: If you want an interactive viewer for gprof2dot output graphs, check xdot.py. Example This is the result from the example data in the Linux Gazette article with the default settings: De performance with gprof. Valgrind. --xml=<yes|no> [default: no] When enabled, the important parts of the output (e.g. tool error messages) will be in XML format rather than plain text.

Furthermore, the XML output will be sent to a different output channel than the plain text output. Therefore, you also must use one of --xml-fd, --xml-file or --xml-socket to specify where the XML is to be sent. Less important messages will still be printed in plain text, but because the XML output and plain text output are sent to different output channels (the destination of the plain text output is still controlled by --log-fd, --log-file and --log-socket) this should not cause problems. This option is aimed at making life easier for tools that consume Valgrind's output as input, such as GUI front ends.