
d3.
D3 Tutorials, D3 Screencasts, and a D3 Newsletter. The 14 Best Data Visualization Tools. Nishith Sharma is the co-founder of frrole, a social intelligence startup.
Raw data is boring and it’s difficult to make sense of it in its natural form. Add visualization to it and you get something that everybody can easily digest. Not only you can make sense of it faster, but you can also observe interesting patterns that wouldn’t be apparent from looking only at stats. All Killer, No Filler This one’s different, trust us. To make the tedious task of making beautiful charts and maps easier, I’ve made the list of best data visualization tools available for the job.
Starting with Canvas for a D3.js addict - Visual Cinnamon. In this blog I’d like to take you through my learnings from last week when I finally started with canvas.
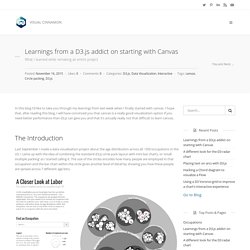
I hope that, after reading this blog, I will have convinced you that canvas is a really good visualization option if you need better performance than d3.js can give you and that it’s actually really not that difficult to learn canvas. Last September I made a data visualization project about the age distribution across all ~550 occupations in the US. I came up with the idea of combining the standard d3.js circle pack layout with mini bar charts, or ‘small multiple packing’ as I started calling it. The size of the circles encodes how many people are employed in that occupation and the bar chart within the circle gives another level of detail by showing you how these people are spread across 7 different age bins.
JavaScript Tutorial. Data Structures D3.js Accepts. The Goal In this section, you will understand how to structure data for better use of D3.js.
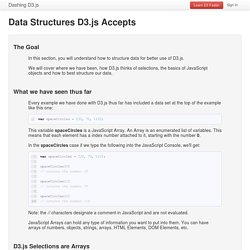
We will cover where we have been, how D3.js thinks of selections, the basics of JavaScript objects and how to best structure our data. What we have seen thus far Every example we have done with D3.js thus far has included a data set at the top of the example like this one: 1var spaceCircles = [30, 70, 110]; This variable spaceCircles is a JavaScript Array.
In the spaceCircles case if we type the following into the JavaScript Console, we'll get: 1var spaceCircles = [30, 70, 110]; 2 3spaceCircles[0] 4 5 6spaceCircles[1] 7 8 9spaceCircles[2] 10 Note: the // characters designate a comment in JavaScript and are not evaluated. Manipulating data like a boss with d3.
Interactive Data Visualization for the Web. Enhanced with examples hosted on JS Bin, courtesy of Remy Sharp and his company, Left Logic.
About the Author Scott Murray is a code artist who writes software to create data visualizations and other interactive phenomena. His work incorporates elements of interaction design, systems design, and generative art. Scott is an Assistant Professor of Design at the University of San Francisco, where he teaches data visualization and interaction design. He is a contributor to Processing, and he teaches workshops on creative coding. Twitter: @alignedleft Interactive Data Visualization for the Web By Scott Murray $23.99 Read Online Buy the Ebook This online version of Interactive Data Visualization for the Web includes 44 examples that will show you how to best represent your interactive data. Be sure to get the full ebook bundle on oreilly.com, which includes downloadable, DRM-free PDF, EPUB, and Mobi versions of the book, as well as free, lifetime updates. CSV To JSON Converter. Convert CSV to JSON Use the tool on this page to convert CSV data to JSON.
Taucharts — Javascript charts with a focus on design and flexibility. Wbkd/awesome-d3. Welcome. Data journalism tools. Javascript Visualisation Libraries. On becoming a code artist. Harvard Stat 221 “Statistical Computing and Visualization”: all lectures online by Harvard Data Science. Stat 221 is Statistical Computing and Visualization.

It’s a graduate class on analyzing data without losing scientific rigor, and communicating your work. Topics span the full cycle of a data-driven project including project setup, design, implementation, and creating interactive user experiences to communicate ideas and results. We covered current theory and philosophy of building models for data, computational methods, and tools such as d3js, parallel computing with MPI, R. All lecture slides are now available online: I feel privileged to have been invited onto this journey together with the students. While the lectures are over, the journey of learning and new discoveries in data-driven projects doesn’t stop here. NVD3.
Tutorials · mbostock/d3 Wiki. Wiki ▸ Tutorials Please feel free to add links to your work!!
Tutorials may not be up-to-date with the latest version 4.0 of D3; consider reading them alongside the latest release notes, the 4.0 summary, and the 4.0 changes. Introductions & Core Concepts Specific Techniques. API Reference · mbostock/d3 Wiki. Www.jeromecukier.net/wp-content/uploads/2012/10/d3-cheat-sheet.pdf. d3 - data driven documents. Bl.ocks.org - about. d3-js - Grupos de Google. Newest 'd3.js' Questions. CSV · mbostock/d3 Wiki · GitHub. Wiki ▸ API Reference ▸ CSV.
API Reference · mbostock/d3 Wiki. Gallery · mbostock/d3 Wiki. Wiki ▸ Gallery Welcome to the D3 gallery!

D3.js - Data-Driven Documents. Interactive Data Visualization for the Web. You are a trouper for making it this far.

We’ve covered a lot of ground, and by now you have a decent handle on D3’s basic concepts and common techniques. If you’ve learned anything, I hope it’s that there are always several (or tens, or hundreds of) ways to accomplish the same task—that’s the joy of programming, right? I’ve presented the ways that, to me, are the simplest or most intuitive, and the least difficult to understand. But there are probably better ways to do anything that you learned in this book, whether “better” means “more computationally efficient” or “makes more sense to you and your way of working.”
I’m a fan of the latter definition. Home · mbostock/d3 Wiki. Understanding selectAll, data, enter, append sequence in D3.js. If you are new to D3.js and have looked at the various D3.js examples on the web to learn it, you have most probably come across a sequence of selectAll(), data(), enter() and append() statements as shown in Example 1 below. To a newcomer to D3.js, it is not obvious how these methods work. At least, initially, I did not find it easy to understand their functioning.
If you are also having some trouble with understanding these methods and how they work together, I think the examples and explanations below will be helpful. The key to understanding the working of these methods is in the following paragraph in Data Keys section on "The key function also determines the enter and exit selections: the new data for which there is no corresponding key in the old data become the enter selection, and the old data for which there is no corresponding key in the new data become the exit selection.
Interactive Data Visualization for the Web. Now we’ll integrate everything we’ve learned so far to generate a simple bar chart as an SVG image. We’ll start by adapting the div bar chart code to draw its bars with SVG instead, giving us more flexibility over the visual presentation. Then we’ll add labels, so we can see the data values clearly. First, we need to decide on the size of the new SVG: //Width and heightvar w = 500;var h = 100;