
Learn More About Performance Improvements in JDK 8 (The Java Tutorials Blog) Each release of the JDK includes enhancements that improves the performance of the Java platform.
The following describes some of these enhancements in JDK 8: The concurrent libraries have undergone a major revision to improve scalability. See Concurrency Utilities Enhancements in Java SE 8. Tiered Compilation, which was introduced in JDK 7, has been enabled by default and brings server VM startup speeds close to or on par with the client VM. Java 8: From PermGen to Metaspace - DZone Java. Discover how you can skip the build and redeploy process by using JRebel by ZeroTurnaround.
As you may be aware, the JDK 8 Early Access is now available for download. This allows Java developers to experiment with some of the new language and runtime features of Java 8. One of these features is the complete removal of the Permanent Generation (PermGen) space which has been announced by Oracle since the release of JDK 7. Interned strings, for example, have already been removed from the PermGen space since JDK 7. The JDK 8 release finalizes its decommissioning. This article will share the information that we found so far on the PermGen successor: Metaspace. The final specifications, tuning flags and documentation around Metaspace should be available once Java 8 is officially released. 5 tips for proper Java Heap size. Determination of proper Java Heap size for a production system is not a straightforward exercise.

In my Java EE enterprise experience, I have seen multiple performance problem cases due to inadequate Java Heap capacity and tuning. This article will provide you with 5 tips that can help you determine optimal Java Heap size, as a starting point, for your current or new production environment. Some of these tips are also very useful regarding the prevention and resolution of java.lang.OutOfMemoryError problems; including memory leaks. Young Generation. Hi All,

Liferay JVM Tuning. When people say JVM tuning, most of the time they mean tuning GC.

Before we start to tune JVM for Liferay Portal, let us talk about some basic conceptions of GC. As we all know jvm can handle useless memory block automaticly, this release us from manually free useless memory blocks which is the NO.1 burden for all C and C++ programmers. With the help from GC our life is much easier, we don't need to worry about memory leak for every single line of our code. But this does not mean you can ignored freeing memory. So let me ask you a very common question: Manually Memory Management VS. The answer will change depending on how you define better, and who is making the definition.Let us see the first part, how do you define better?
For the second part, who is making the definition? If you are not very good at Manually Memory Management, you will be very easy to make following mistakes: How to Monitor Java Garbage Collection. This is the second article in the series of "Become a Java GC Expert".
In the first issue Understanding Java Garbage Collection we have learned about the processes for different GC algorithms, about how GC works, what Young and Old Generation is, what you should know about the 5 types of GC in the new JDK 7, and what the performance implications are for each of these GC types. In this article, I will explain how JVM is actually running Garbage Collection in the real time. Liferay Tips: Liferay Performance Tuning. As an infrastructure portal, the portal can support over 3300 concurrent users on a single server with mean login times under 0.5 a second and maximum throughput of 79+ logins per second.

In collaboration and social networking scenarios, each physical server supports over 1300 concurrent users at average transaction times of under 800 ms. The portal’s CMS/WCM scales to beyond 150,000 concurrent users on a single Portal server with average transaction times under 50ms and 35% CPU utilization. Given sufficient database resources and efficient load balancing, the portal can scale linearly as one adds additional servers to a cluster.How to achieve this?
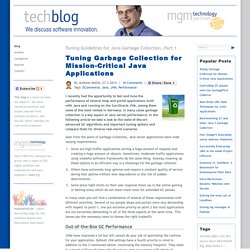
Here we list ten golden rules. As shown in above code, Audit Filer, SSO CAS Filter, SSO NTLM Filter, SSO OpenSSO Filter, Virtual Host Filter and SharePoint Filter got turned off. Tuning Tomcat Performance For Optimum Speed - A Step-By-Step Guide. Tomcat configuration is by default geared towards first time users looking for powerful, hassle-free, out-of-the-box functionality.

However, when deployed in a real-world setting, where high server load can be expected and achieving the best possible peak load performance is vital, it is important to customize these default settings based on your site's needs. This may seem like a daunting task, and it is certainly not a small one, but the good news is that Tomcat is a very configurable system, and by following a logical process of testing and implementation, you can vastly improve your site's performance. Are you tuning Tomcat for performance? Tcat gives you deep visibility into the performance of your web applications, and allows you to save optimal configurations.
Get new instances up and running with a single click. Understanding Limits Before getting down to business, let's take a look at the biggest limits on your site's performance. Tuning Garbage Collection for Mission-Critical Java Applications - Tuning Guidelines for Java Garbage Collection, Part 1 « mgm technology blog.
I recently had the opportunity to test and tune the performance of several shop and portal applications built with Java and running on the Sun/Oracle JVM, among them some of the most visited in Germany.
In many cases garbage collection is a key aspect of Java server performance. In the following article we take a look at the state-of-the-art advanced GC algorithms and important tuning options and compare them for diverse real-world scenarios. Seen from the point of Garbage Collection, Java server applications have wide varying requirements: Some are high-traffic applications serving a huge amount of requests and creating a huge amount of objects. Sometimes, moderate-traffic applications using wasteful software frameworks do the same thing.