
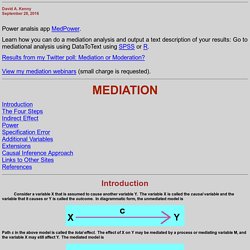
Mediation (David A. Kenny) Some might benefit from Muthén (2011).
Note that both the CDE and the NDE would equal the regression slope or what was earlier called path c' if the model is linear, assumptions are met, and there is no XM interaction affecting Y, the NIE would equal ab, and the TE would equal ab + c'. SEM with Latent Variables (David A. Kenny) Problems with Testing of Parameters Using the Wald Test The Problem (see the Gonzalez & Griffin, Psychological Methods, 2001) Markers A → I (CR) A1, I1 4.116 A2, I1 4.028 A1, I2 3.736 A2, I2 3.670 Result: Critical ratios depend on the choice of the marker.
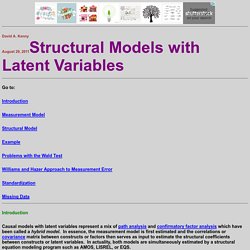
If you change the marker variable, some things change in the model and some things say the same. SEM: Fit (David A. Kenny) David A.
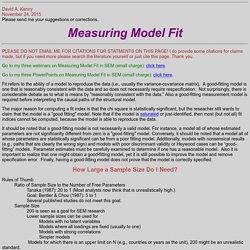
Kenny November 24, 2015 Please send me your suggestions or corrections. Measuring Model Fit PLEASE DO NOT EMAIL ME FOR CITATIONS FOR STATMENTS ON THIS PAGE! I do provide some citations for claims made, but if you need more please search the literature yourself or just cite this page. Thank you. Fit indices for structural equation modeling / smoss2 - Sicotests. Dr.
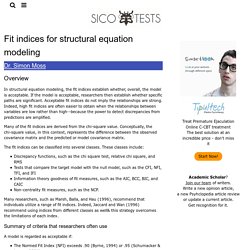
Simon Moss Overview In structural equation modeling, the fit indices establish whether, overall, the model is acceptable. SEM: Respecification (David A. Kenny) David A.
Kenny September 11, 2011. SEM: Confirmatory Factor Analysis (David A. Kenny) David A.
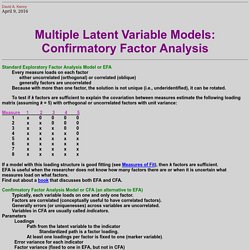
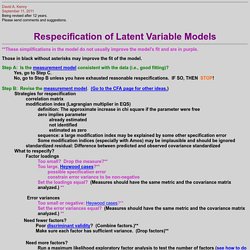
KennyApril 9, 2016 Multiple Latent Variable Models: Confirmatory Factor Analysis Standard Exploratory Factor Analysis Model or EFA Every measure loads on each factor either uncorrelated (orthogonal) or correlated (oblique) generally factors are uncorrelated Because with more than one factor, the solution is not unique (i.e., underidentified), it can be rotated. To test if k factors are sufficient to explain the covariation between measures estimate the following loading matrix (assuming k = 5) with orthogonal or uncorrelated factors with unit variance: 12.8 - Example: Places Rated Data. This method of factor analysis is being carried out using places3.sas as shown below: Here we have specified the Maximum Likelihood Method by setting method=ml.
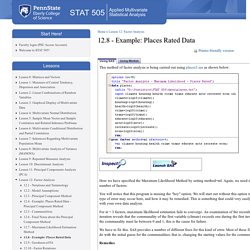
Again, we need to specify the number of factors. You will notice that this program is missing the "hey" option. We will start out without this option to see what type of error may occur here, and how it may be remedied. Home page English version. Parametric vs Nonparametric Tests: When to use which. Data Not Normal? Try Letting It Be, with a Nonparametric Hypothesis Test. So the data you nurtured, that you worked so hard to format and make useful, failed the normality test.
Chi-Square Test of Independence - Statistics Solutions. How to calculate the chi-square statistic by hand.

First we have to calculate the expected value of the two nominal variables. We can calculate the expected value of the two nominal variables by using this formula: Where = expected value. 3.14 Model Diagnostics and Checking your Assumptions. Checking the final version of the model So far we have looked at building a multiple regression model in a very simple way.
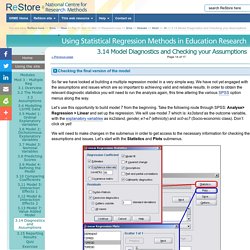
We have not yet engaged with the assumptions and issues which are so important to achieving valid and reliable results. In order to obtain the relevant diagnostic statistics you will need to run the analysis again, this time altering the various SPSS option menus along the way. Let’s use this opportunity to build model 7 from the beginning.
Take the following route through SPSS: Analyse> Regression > Linear and set up the regression. Variance – What Is It? The variance is a number that indicates how far a set of numbers lie apart. The variance is identical to the squared standard deviation and hence expresses “the same thing” (but more strongly). Variance - Example A study has 100 people perform a simple speed task during 80 trials. For each participant, 80 reaction times (in seconds) are thus recorded. SPSS Tutorials. Doing Survey Research. What statistical analysis should I use? Statistical analyses using Stata - IDRE Stats. Version info: Code for this page was tested in Stata 12.
Introduction This page shows how to perform a number of statistical tests using Stata. Each section gives a brief description of the aim of the statistical test, when it is used, an example showing the Stata commands and Stata output with a brief interpretation of the output. You can see the page Choosing the Correct Statistical Test for a table that shows an overview of when each test is appropriate to use. In deciding which test is appropriate to use, it is important to consider the type of variables that you have (i.e., whether your variables are categorical, ordinal or interval and whether they are normally distributed), see What is the difference between categorical, ordinal and interval variables?
E-lomake. SPSS (video 3/6) -Descriptive Statistics. IEA Study Data Repository / index / index. Normal Distribution. Data can be "distributed" (spread out) in different ways. But there are many cases where the data tends to be around a central value with no bias left or right, and it gets close to a "Normal Distribution" like this: Data Archive. The Finnish Social Science Data Archive archives and disseminates quantitative and qualitative research data in digital format. The FSD does not archive research reports or other publications related to archived datasets, nor can these be ordered via the archive. » Read more Data Catalogue FSD's online data service Aila facilitates access to data.
Registered users can download data online, according to the conditions set for each dataset.
Mean, Median and Mode from Grouped Frequencies. Explained with Three Examples The Race and the Naughty Puppy This starts with some raw data (not a grouped frequency yet) ... Alex timed 21 people in the sprint race, to the nearest second: To find the Mean Alex adds up all the numbers, then divides by how many numbers:
Standard Deviation and Variance. SPSS: Stacked Relative Bar Chart of multiple variables. Why Statistics matters? A Day Without Statistics. Why You Need to Study Statistics. Introduction to Statistics. Chi-Square Test of Independence - SPSS Tutorials - LibGuides at Kent State University. Problem Statement. SPSS Data files and exercises. OWL. SPSS Data files and exercises. Data files Throughout the SPSS Survival Manual you will see examples of research that is taken from a number of different data files, survey.zip, error.zip, experim.zip, depress.zip, sleep.zip and staffsurvey.zip.
To use these files, which are available here, you will need to download them to your hard drive or memory stick. Once downloaded you'll need to unzip the files. To do this, right click on the downloaded zip file and select 'extract all' from the menu. Data files. These are SPSS data files for use in our lessons. Some are my data, a few might be fictional, and some come from DASL. DASL is a good place to find extra datasets that you can use to practice your analysis techniques. Purdue OWL. Data Sets used in SPSS Tutorials. SPSS Data files and exercises. Paired Samples t Test - SPSS Tutorials - LibGuides at Kent State University. Problem Statement The sample dataset has placement test scores (out of 100 points) for four subject areas: English, Reading, Math, and Writing. Suppose we are particularly interested in the English and Math sections, and want to determine whether English or Math had higher test scores on average.
European Social Survey (ESS) Reporting a single linear regression in apa. Quantitative Research Methods and Analysis Syllabus. Course Description: Quantitative Research Methods and Analysis is the second course in the two-course methods/statistics sequence. Students enrolled in this course must have taken Soc 2155 and earned a grade of at least "C. " This course reviews and extends student knowledge of the statistics commonly used in sociology and criminology research. Scientific Method. ED132982. #2.1 Data Screening.
Testing for Normality using SPSS Statistics when you have only one independent variable. How do I interpret data in SPSS for a 1-way between subjects ANOVA?