
Some of The Best Word Cloud Generators for Teachers and Students. January 21, 2017 A word cloud is a visual representation of the frequencies of words in a text.

Teachers can use word clouds for a variety of instructional purposes from creating class groups using students' names to reflecting on lesson plans, this article from 21st Century Educational Technology and Learning Blog outlines over a 100 creative ways you can use word clouds with students in class. Now that you have an idea of the educational and pedagogical potential of word clouds in class instruction, here are some of our favourite web tools an iPad apps we uncovered from our archive which you can utilize to easily generate and share word clouds. Check them out and share with us your feedback in our Facebook page. Web Tools 1- Wordle ‘Wordle is a toy for generating “word clouds” from text that you provide.
Exhibit. Feel, Act, Make sense. Infoactive. 20+ Tools to Create Your Own Infographics. A picture is worth a thousand words – based on this, infographics would carry hundreds of thousands of words, yet if you let a reader choose between a full-length 1000-word article and an infographic that needs a few scroll-downs, they’d probably prefer absorbing information straight from the infographic. What’s not to like? Colored charts and illustrations deliver connections better than tables and figures and as users spend time looking back and forth the full infographic, they stay on the site longer. Plus, readers who like what they see are more likely to share visual guides more than articles. While not everyone can make infographics from scratch, there are tools available on the Web that will help you create your very own infographics.
In this article, we’re listing more than 20 such options to help you get your messages across to your readers, visually. Read Also: The Infographic Revolution: Where Do We Go From Here? What About Me? “What About Me?” Vizualize.me Piktochart easel.ly. Free Data Visualization Software. Chart Tools. GeoCommons. Many Eyes.
Create and design your own charts and diagrams online. Sci² Tool : A Tool for Science of Science Research and Practice. ChartsBin.
Gapminder. Do you want to use Gapminder tools in your classroom?
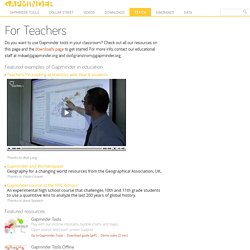
Check out all our resources on this page and the downloads page to get started. For more info, contact our educational staff at mikael@gapminder.org and olof.granstrom@gapminder.org . Featured examples of Gapminder in education Teachers TV: Looking at statistics with Year 8 students[Javascript required to view Flash movie, please turn it on and refresh this page]Thanks to: Bob LangGapminder and Worldmapper Geography for a changing world resources from the Geographical Association, UK.Thanks to: Paula CooperGapminder course at the NYC iSchool An experimental high school course that challenges 10th and 11th grade students to use a quantitive lens to analyze the last 200 years of global history.Thanks to: Jesse Spevack Featured resources.
Webgraphics. Visual editor. Google Graphing Calculator. Google has decided to make its simple search box into yet another thing.
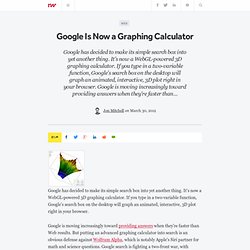
It's now a WebGL-powered 3D graphing calculator. If you type in a two-variable function, Google's search box on the desktop will graph an animated, interactive, 3D plot right in your browser. Google is moving increasingly toward providing answers when they're faster than Web results. But putting an advanced graphing calculator into search is an obvious defense against Wolfram Alpha, which is notably Apple's Siri partner for math and science questions. Google search is fighting a two-front war, with Facebook and social search on the other side. Google has had Universal Search for five years, but the landscape has shifted drastically. This ill will is coming back to bite Google now. Likewise, Siri uses Wolfram Alpha for math and science questions. Well, not until WebGL works on phones. Chartle. Easel.ly.
ChartGo. Mapyourinfo. AGBeat. The rise in demand for visualization of information in the form of graphics and infographics is happening at a staggering pace and these visualizations are popping up in board rooms across America, on blogs and social networks, and in client presentations, in an effort to present data in a memorable, easy to digest visual format.

Truth be known, most of these visualizations are just as ugly as a Power Point presentation theme from 1994, but at least people are trying, we suppose. Speaking of Power Point, many people whip out their drag and drop skills and create “infographics” for lack of a better term, to achieve their goal of visualization, but this often falls short.
Yesterday, AGBeat introduced you to Piktochart, an infographic app for busy professionals that come with pre-loaded themes of infographics that are far superior to most peoples’ PPT skills. But sometimes, you may be looking for a fast, simple way to add a single chart to your blog to illustrate a point. Visual.ly.