
Five-Minute Film Festival: Banned Books. Inventing Infographics: Visual Literacy Meets Written Content. I'll admit it.
In my early years as a teacher, I thought that encouraging students to improve their writing invariably involved encouraging greater depth, adding more detail, crafting more complex sentences. In short, I implied to my students that the most valuable revisions involved adding to our work and that writing better equaled writing longer. Enter the infographic, the twenty-first century text/structure/genre/design that blows my earlier beliefs about "better = longer" right out of the water.
As texts compete for attention with soundbites, scrolling headlines, tweets, and vines, writers and readers alike are seeing the value of text that uses visual design features to organize ideas, provide background, and emphasize key facts in ways that make it easier for readers to engage a topic thoughtfully. I have always encouraged my student writers to "swim deeply" when they read and write, moving beyond the basics, braving the imposing waters at the "deep end of the pool.
" Teaching Information Literacy Skills. Verification Handbook. The 6 Skills for Researching Online Information Students should Know about. February 18, 2014 With Internet becoming the number one source of information students flock to when looking for resources and references for their researches, it becomes imperative that we make sure that our students are equipped with the appropriate gear to keep them afloat in a sea of information and junk knowledge.
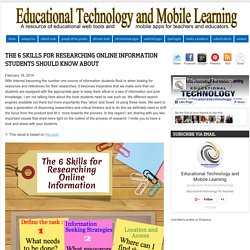
I am not talking here about the tools students need to use such as the different search engines available out there but more importantly they 'whys' and 'hows' of using these tools. We want to raise a generation of discerning researchers and critical thinkers and to do this we definitely need to shift the focus from the product and tilt it more towards the process. In this regard I am sharing with you two important visuals that shed more light on the outline of the process of research. I invite you to have a look and share with your students. 1- This visual is based on this post 2-The Kentucky Virtual Library " How to Do Research " Home - Big6.
Information Literacy. 10 Ways Teacher Planning Should Adjust To The Google Generation. 10 Ways Teacher Planning Should Adjust To The Google Generation by Terry Heick For the Google Generation, information isn’t scarce, and knowing has the illusion of only being a search away.
I’ve written before about how Google impacts the way students think. This post is less about students, and more about how planning resources like standards and curriculum maps might respond accordingly. Curriculum maps are helpful little documents that standardize learning. The problem is, now more than ever, critical knowledge is changing. In the presence of Google, predictive search, digital communities, social media, Quora, adaptive apps, and other technology, information is less scarce than it has ever been in human history. There is a subreddit for transhumanism.
That’s pretty incredible. There’s also one for education, science, the future, the past, self-directed learning, teaching, books, technology, and almost any other topic you can think of. 1. 2. 3. 4. See #2. 5. In 2014, we can do better. 6. What The Data Says About Students' 21st Century Readiness. What The Data Says About Students’ 21st Century Readiness 21st century skills is a term that’s been bandied about for over a decade now.
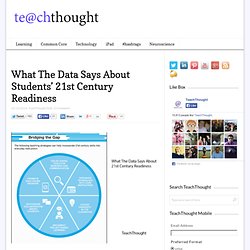
Loosely, it refers to the creative and technology-based skills students are increasingly required to demonstrate to use information in the real world. While there’s plenty of tools, leadership, strategies, and even rhetoric surrounding this discussion, what’s there’s less of is data. The following infographic from learning.com/21cs helps soften that reality a bit by graphically displaying the data from over 500,000 elementary and middle school assessments framed around ISTE’s technology standards. It then goes on to offer areas of strength (digital citizenship and technology operation) and weakness (research, critical thinking, problem solving).
But hey, all is not lost. This number seem a bit high to anyone? What The Data Says About Students’ 21st Century Readiness.