
CDM. Sea-levels. Tan's interests. February Economic Summary in Graphs. Here is a collection of 20 real estate and economic graphs from February ...

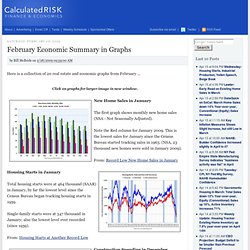
Click on graphs for larger image in new window. New Home Sales in January The first graph shows monthly new home sales (NSA - Not Seasonally Adjusted). Water withdrawal and consumption: the big gap - Maps and Graphics at UNEP/GRID-Arendal. The GRID-Arendal Maps & Graphics Library is an on-going project to collect and catalogue all graphic products that have been prepared for publications and web-sites from the last 15 years in a wide range of themes related to environment and sustainable development.

There are currently 3022 graphics available in the database. Global flyways of the six subspecies of Red Knot The Red Knot is a migratory shorebird that travels up to 20,000 km twice a year from its breeding grounds on the high Arctic tundra to its southern non-breeding sites. Along with having one of the longest total migrations of any bird, some populations also fly as much as 8,000–9,000 km between stopover sites in a single flight. World carbon emissions since 1902. Reuters AlertNet - GRAPHIC-World carbon emissions since 1902. China power output in record Nov decline.