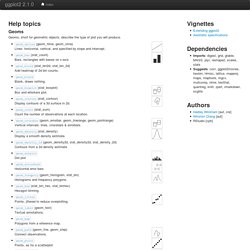

Amelia. Ggplot2. Geoms Geoms, short for geometric objects, describe the type of plot you will produce. geom_abline(geom_hline, geom_vline) Lines: horizontal, vertical, and specified by slope and intercept.

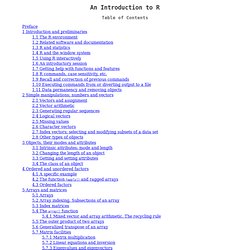
Geom_bar(stat_count) Bars, rectangles with bases on x-axis geom_bin2d(stat_bin2d, stat_bin_2d)Add heatmap of 2d bin counts. Geom_blankBlank, draws nothing. Geom_boxplot(stat_boxplot) Box and whiskers plot. An Introduction to R. Table of Contents This is an introduction to R (“GNU S”), a language and environment for statistical computing and graphics.

R is similar to the award-winning1 S system, which was developed at Bell Laboratories by John Chambers et al. It provides a wide variety of statistical and graphical techniques (linear and nonlinear modelling, statistical tests, time series analysis, classification, clustering, ...). This manual provides information on data types, programming elements, statistical modelling and graphics.