
Mindmapping. Veille et données - Outils Froids.
Cool. Diagrams. Thinking-guides. A Periodic Table of Visualization Methods. Cluster/Cloud Graphic Organizer Printouts. Cluster diagrams (also called cloud diagrams) are a type of non-linear graphic organizer that can help to systematize the generation of ideas based upon a central topic.
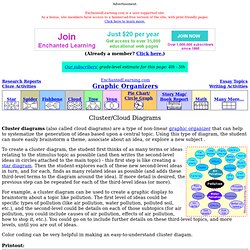
Using this type of diagram, the student can more easily brainstorm a theme, associate about an idea, or explore a new subject . To create a cluster diagram, the student first thinks of as many terms or ideas relating to the stimulus topic as possible (and then writes the second-level ideas in circles attached to the main topic) - this first step is like creating a star diagram. Then the student explores each of these new second-level ideas in turn, and for each, finds as many related ideas as possible (and adds these third-level terms to the diagram around the idea). If more detail is desired, the previous step can be repeated for each of the third-level ideas (or more).