
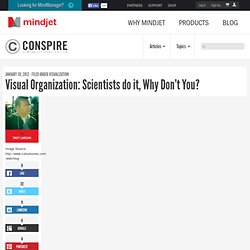
The Key to Media's Hidden Codes. How to use FF Chartwell. Primarily suitable for Adobe Creative Suite, FF Chartwell for print uses OpenType ligatures to transform strings of numbers automatically into charts.
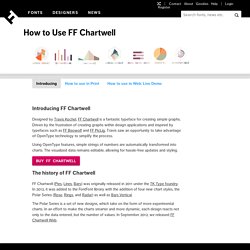
The data remains in a text box, allowing for easy updates and styling. It’s really simple to use; you just type a series of numbers like: ‘10+13+37+40’, turn on Stylistic Alternates or Stylistic Set 1 and a graph is automatically created. To help get you started using FF Chartwell we’ve created this video tutorial and here are some simple steps: ONE — Firstly always make sure the letter spacing is set to “0” (zero) TWO — Using the values 0-100, type the values, then use “+” to combine them into one chart. THREE — Want to bring a bit of color to your work? FOUR — Turn on Stylistic Alternates or Stylistic Set 1 and enjoy! To see the original data all you need to do is turn off Stylistic Set or Stylistic Alternates.
Visualising Data. Visual thinking: los garabatos toman las riendas en la oficina. Antes de las palabras estuvieron los dibujos.
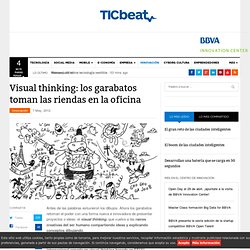
Ahora los garabatos retoman el poder con una forma nueva e innovadora de presentar proyectos o ideas: el visual thinking, que vuelve a las raíces creativas del ser humano compartiendo ideas y explicando conceptos dibujando. Para poder entender el nuevo recurso hemos hablado con Scott Matthews, el director creativo de Dachis Group, una empresa internacional experta en visual thinking basada en EEUU.
Digital visualization as a scholarly activity. Martyn Jessop Correspondence: Martyn Jessop, Centre for Computing in the Humanities, King's College London Strand, London WC2R 2LS, UK.
E-mail: martyn.jessop{at}kcl.ac.uk Thought processes are enhanced when ways are found to link external perception with internal mental processes by the use of graphic aids. Syntactic Theory of Visual Communication. Paul Martin Lester, Ph.D.
Professor Department of Communications California State University at Fullerton Fullerton, California 92634 VOX: 657/278-4604 FAX: 657/278-2209 VAX: lester@fullerton.edu (c) 2006 There can be no words without images. ---Aristotle Archeologists in the year 3706 uncovering the buried ruins of any major city in the world will no doubt find text on billboards, storefronts, traffic signs, and so on in the languages we know and use today. These words however will probably not be understood by 38th Century scientists because languages of today will eventually become obsolete and forgotten.
Before we are four years old, most of us have learned The Alphabet Song. Before children learn to read and write, they do not know the difference between a line drawing and a letter. Early on however, we are taught to make distinctions between words and pictures and to not think of them in the same way. There are strong indications that the status of images is improving. Visualize This: The FlowingData Guide to Design, Visualization, and Statistics. Louis LÉVY Formations. Visual Organization: Scientists do it, Why Don’t You?
Ever been asked to find a specific file for someone and just plain can’t or it takes a good ten minutes to find it?
Sure. We’ve all been there before. Interestingly enough, scientists could be changing that. Recently I came across this cool article from the National Science Foundation (NSF), talking about how scientists are now using a cool tool that helps them visually organize related documents. The Visual Thinking Revolution is Here! We are in the midst of a “Visual Thinking Revolution” and leaders in all types of organizations are embracing visual thinking as a literacy of the future.
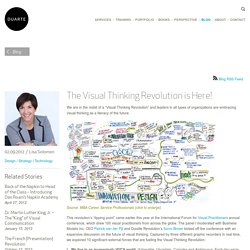
Source: MBA Career Service Professionals (click to enlarge) This revolution’s “tipping point” came earlier this year at the International Forum for Visual Practitioners annual conference, which drew 100 visual practitioners from across the globe. The panel I moderated with Business Models Inc. Traiter_information_grace_au_mindmapping.pdf (Objet application/pdf) Download. Clay_anderson MusicLine on Twusic. Infographic: Get More Out Of Google. What-is-visual-thinking1.jpg (JPEG-afbeelding, 980x360 pixels) Synesthésie. Une personne atteinte de synesthésie peut par exemple, percevoir ainsi les chiffres et les lettres, associés à des couleurs (1,1 à 2,0 % de la population selon Simner et al. en 2006)[1].
Si des métaphores exprimant un croisement de sens sont parfois qualifiées de « synesthétiques », la vraie synesthésie est neurologique et involontaire. Une personne sur 23, (environ 4 % de la population ) serait concernée[4]. Déterminer précisément le nombre de personnes véritablement synesthètes dans une population est néanmoins délicat car cette notion est une perception personnelle (subjective).
On peut vivre avec une synesthésie sans le savoir[5], se déclarer synesthète sans l'être véritablement, ou à des degrés considérablement moindres que d'autres personnes, s'approchant d'une perception « normale ». Ainsi, il a pu être avancé que seule une personne sur 2 000[4] serait synesthésique, une statistique qui semble désormais erronée. Critères diagnostiques[modifier | modifier le code] Kevin T. Copy Queries(RSZC) across infoprovi. Copying queries across infoproviders which is done using RSZC is a well discussed topic and available on help.sap.Similary, copying queries across infoproviders which are not alike is a widely discussed topic too.Some of the solutions for this are as below: Method 1: Setting debug point as in this wiki.
Method 2: Using ABAP as in this article. Visual Thinking Evolution. A mind map is a diagram used to represent words, ideas, tasks, or other items linked to and arranged around a central key word or idea.

Especially in British English, the terms spidergram and spidergraph are more common,[1] but they can cause confusion with the term spider diagram used in mathematics and logic. Mind maps are used to generate, visualize, structure, and classify ideas, and as an aid to studying and organizing information, solving problems, making decisions, and writing.
The elements of a given mind map are arranged intuitively according to the importance of the concepts, and are classified into groupings, branches, or areas, with the goal of representing semantic or other connections between portions of information. Mind maps may also aid recall of existing memories.