
OpenLayers: Home. Create a map. Story Maps. MapBox. Leaflet. Login - ChartsBin.com. MBAD 5107-Economic Geography on Sourcemap. Indiemapper. Scale. Design. Neatline.org. Neatline is a lightweight, extensible framework for creating interactive editions of visual materials – maps, paintings, photographs, and anything else that can be captured as an image.
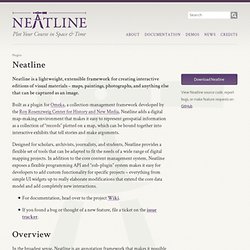
Built as a plugin for Omeka, a collection-management framework developed by the Roy Rosenzweig Center for History and New Media, Neatline adds a digital map-making environment that makes it easy to represent geospatial information as a collection of “records” plotted on a map, which can be bound together into interactive exhibits that tell stories and make arguments. Designed for scholars, archivists, journalists, and students, Neatline provides a flexible set of tools that can be adapted to fit the needs of a wide range of digital mapping projects. For documentation, head over to the project Wiki.If you found a bug or thought of a new feature, file a ticket on the issue tracker. Here are some examples of the kinds of projects that could be built (or have been built!) Map Maker. Google Map Maker officially closed on March 31, 2017, and many of its features are being integrated into Google Maps.
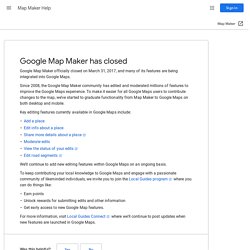
Since 2008, the Google Map Maker community has edited and moderated millions of features to improve the Google Maps experience. StepMap - Create your personal map for free. Edit Map Info. ChartsBin.com - Visualize your data. MapQuery. GunnMap 2. Tour MapBox. Global coverage and fresh design MapBox Streets is a beautiful alternative to Google Maps powered by high-quality open data from OpenStreetMap, available now from MapBox. Liberate your maps with global street level detail, rich features, and your own custom design. Apply custom styles MapBox streets comes in a variety of gorgeous preset color schemes, or you can take control and customize the color levels and features of your map.
Beautiful maps for the web and mobile. Animaps. Earth Outreach. This tutorial shows you how to enter data in an on-line spreadsheet to generate a set of placemarks in Google Earth and Maps.
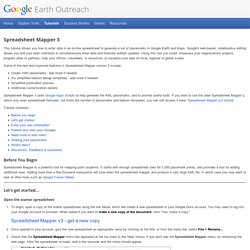
Google's web-based, collaborative editing allows you and your team members to simultaneously enter data and instantly publish updates. Using this tool you could: showcase your organization's projects, program sites or partners; map your offices, volunteers, or resources; or visualize your data on local, regional or global scales. Some of the new and improved features in Spreadsheet Mapper version 3 include: Create 1000 placemarks - add more if needed. Six simplified balloon design templates - add more if needed Simplified publication process Additional customization options Spreadsheet Mapper 3 uses Google Apps Scripts to help generate the KML placemarks, and to provide useful tools. Download flash charts and graphs. Indiemapper - Free yourself from GIS.
Upload your spreadsheet. Create Flash Maps. To create custom interactive maps for use in StatPlanet, you need the following: See also: To prepare the map so it can be loaded into StatPlanet, you need two layers: Map layer: This layer will contain the map shapes (e.g. regions or provinces).
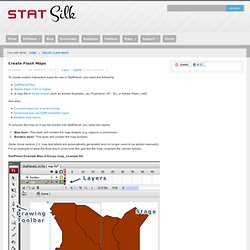
Borders layer: This layer will contain the map borders. (Note: since version 2.3, map text labels are automatically generated and no longer need to be added manually). StatPlanet Example Map of Kenya (map_example.fla) Step 1. Open a new document (File -> New). Step 2. Once you have created the map Movie Clips, your borders may have become hidden from view.
Step 3. Once your map is ready, publish the file (File -> Publish). Step 4. In the sheet 'Import', replace the example names (which are Kenya province names) with your own names, in the order that you wish. Step 5. To change the position and size of the map, move the mouse to the bottom-right of the screen to see the map zoom controls: Step 6. Leaflet - a modern, lightweight JavaScript library for interactive maps by CloudMade - Download. View Changelog Note that the master version can contain incompatible changes, so please read the changelog carefully when upgrading to it.
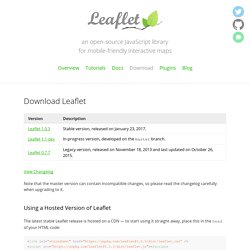
Using a Hosted Version of Leaflet The latest stable Leaflet release is hosted on a CDN — to start using it straight away, place this in the head of your HTML code: Using a Downloaded Version of Leaflet. SHOW®/WORLD - A New Way To Look At The World. MapTube. Florida/1860slavepop. Powered by WorldMap florida/1860slavepop Sign in | Create Map | View Map | Help Search for geospatial data Selected Data Refine Search By area Limit the search to data that includes features in the displayed area.
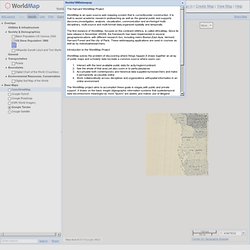
Refine Rectify Images Use WorldMap WARP to upload and rectify scanned maps for use in WorldMap. 100 km 50 mi Center for Geographic Analysis The Harvard WorldMap Project WorldMap is an open source web mapping system that is currentlyunder construction. The first instance of WorldMap, focused on the continent ofAfrica, is called AfricaMap. Introduction to the WorldMap Project WorldMap solves the problem of discovering where things happen.It draws together an array of public maps and scholarly data tocreate a common source where users can: The WorldMap project aims to accomplish these goals in stages,with public and private support.
Socrata. Interactive maps and visualizations. Welcome! - WorldMap. Dashboard - ChartsBin.com. uLearn by Infomapper - online maps for schools. Weave. TargetMap - Create & share customized data maps on Googlemaps. Free Online Mapping tool. OpenPaths. Kartograph – rethink mapping. OpenLayers: Home.