
CogDogRoo - StoryTools. 50 Web 2.0 Ways to Tell a Story (return) Note!

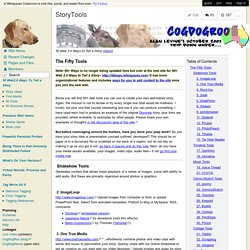
50+ Ways is no longer being updated here but over at the new site for 50+ Web 2.0 Ways to Tell a Story-- It has more organizational features and includes ways for you to add content to the site once you join the new wiki. Below you will find 50+ web tools you can use to create your own web-based story. Again, the mission is not to review or try every single one (that would be madness, I know), but pick one that sounds interesting and see if you can produce something. I have used each tool to produce an example of the original Dominoe story, plus links are provided, where available, to examples by other people. Slideshow Tools Generates content that allows linear playback of a series of images, some with ability to add audio. 2.
Upload images from computer or flickr or upload PowerPoint files. 3. "...effortlessly combine photos and video clips with words and music to personalize your story. 6 Free Websites For Public Domain Images & Free Stock Photos. Public Domain Pictures This page is a repository for public domain images.

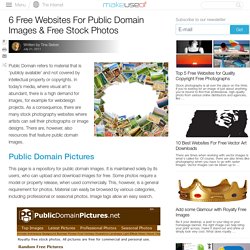
It is maintained solely by its users, who can upload and download images for free. Some photos require a model or property release, when used commercially. This, however, is a general requirement for photos. Material can easily be browsed by various categories, including professional or seasonal photos. The page for each image contains detailed information about the license, the camera used to take it, and links to the artist. Wikimedia Commons Most images used on Wikipedia are part of the Wikimedia Commons, a database of over 10 million freely usable media files, including public domain images. The dedicated page for each features details about the item, including the permission for use and any licenses associated with the file. Image After Image After describes itself as the raw base for your creativity. Public Domain Photos Stock.XCHNG To download material you have to sign up with Stock.XCHNG.
Flickr. The Anatomy Of An Infographic: 5 Steps To Create A Powerful Visual. Information is very powerful but for the most bit it is bland and unimaginative.

Infographics channel information in a visually pleasing, instantly understandable manner, making it not only powerful, but extremely beautiful. Once used predominantly to make maps more approachable, scientific charts less daunting and as key learning tools for children, inforgraphics have now permeated all aspects of the modern world. I designed a couple of infographics back in college, the need arising especially around the time Soccer World Cup fever spiked. It was a fun process representing the different groups, predicting winners in each group at each stage and creating a mock pairing of teams that would clash all the way leading upto the finals. Tips, tricks and resources to make your own gorgeous infographics. Infographics (or Information Graphics) are graphic visual representations of data or information, presented in a way to make it easier to consume information.

Infographics gained popularity in the mid-2000′s with the advent of sites like Digg and Reddit, and have quickly become one of the most popular methods to display researched data. There are three main types of infographics – where data is presented in a timeline, where statistical data is presented in graphs or with icons, or where data is presented on a map. In order to create an infographic which will be widely shared, think about your typography, colours, and layout. 10 Awesome Free Tools To Make Infographics. Advertisement Who can resist a colourful, thoughtful venn diagram anyway?

In terms of blogging success, infographics are far more likely to be shared than your average blog post. This means more eyeballs on your important information, more people rallying for your cause, more backlinks and more visits to your blog. In short, a quality infographic done well could be what your blog needs right now. How To Create Outstanding Modern Infographics. In this tutorial you will learn that data doesn't have to be boring, it can be beautiful!

Learn how to use various graph tools, illustration techniques and typography to make an accurate and inspiring infographic in Adobe Illustrator. Start by using the Rectangle Tool (M) to draw a shape. Give it a subtle radial gradient too. The entire design is based on a grid of four columns. To make the columns first select the rectangle and drag a guide onto the centre of the shape.
Condense the shape so it fits within the left-most guide and centre guide. What Makes a Good Infographic? Not even the experts agree.

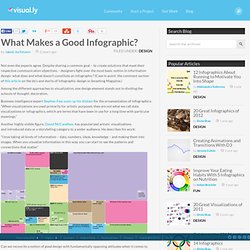
Despite sharing a common goal – to create solutions that meet their respective communication objectives – designers fight over the most basic notion in information design: what does and what doesn’t constitute an infographic? (Case in point: the comment section of this article on the do’s and don’ts of infographic design in Smashing Magazine.) Among the different approaches to visualization, one design element stands out in dividing the schools of thought: decoration. Business intelligence expert Stephen Few sums up his disdain for the ornamentation of infographics: “When visualizations are used primarily for artistic purposes, they are not what we call data visualizations or infographics, which are terms that have been in use for a long time with particular meanings.” eEtiquette – 101 Guidelines for the Digital World.