
JESS3. Welcome to freeDive: Data sharing for everyone. Create interactive charts and infographics - Infogr.am. Datamob: Public data put to good use. Envisioning life. Infographics & Data Visualizations. Processing.org. Derek Watkins. Politilines. Re.vu. Vizualize.me: Visualize your resume in one click.
ChartsBin.com - Visualize your data. ImagePlot visualization software: explore patterns in large image collections. What is ImagePlot?
ImagePlot is a free software tool that visualizes collections of images and video of any size. It is implemented as a macro which works with the open source image processing program ImageJ. ImagePlot was developed by the Software Studies Initiative with support from the National Endowment for Humanities (NEH), the California Institute for Telecommunications and Information Technology (Calit2), and the Center for Research in Computing and the Arts (CRCA). See your whole image collection in a single visualization. Existing visualization tools show data as points, lines, and bars. Better understand media collections and make new discoveries. Visualize image collections as timelines and scatter plots which display all images in a collection. Visualize change. We include macros which automatically measure various visual properties of every image in collection (or every frame in a video). Visualize image collections of any size. From a few dozens to millions of images.
Envisioning life. Data Visualization. Zipped shape file, Turkey - EEA reference grids — EEA. Map Library. StatPlanet Map Maker – Interactive Mapping & Visualization Software. Collates the most creative and innovative visualisations of information. Visualizing Economics. Weave (Web-based Analysis and Visualization Environment) Timeline. Data visualization tools for Linux. A short list of visualization tools In this article, I provide a survey of a number of popular Linux data visualization tools and include some insight into their other capabilities.
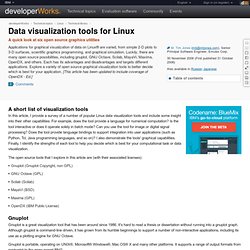
For example, does the tool provide a language for numerical computation? Is the tool interactive or does it operate solely in batch mode? Can you use the tool for image or digital signal processing? Does the tool provide language bindings to support integration into user applications (such as Python, Tcl, Java programming languages, and so on)? The open source tools that I explore in this article are (with their associated licenses): Gnuplot (Gnuplot Copyright, non GPL)GNU Octave (GPL)Scilab (Scilab)MayaVi (BSD)Maxima (GPL)OpenDX (IBM Public License) Gnuplot Gnuplot is a great visualization tool that has been around since 1986.
Gnuplot is portable, operating on UNIX®, Microsoft® Windows®, Mac OS® X and many other platforms. Listing 1. Listing 1 illustrates the simplicity of gnuplot's command set. Figure 1. Axiis : Data Visualization Framework. Introduction to Circos, Features and Uses // CIRCOS Circular Genome Data Visualization. Ideas, issues, knowledge, data - visualized! Data Visualization. Data Visualization, Infographics, and Statistics. Information aesthetics - Information Visualization & Visual Communication. Datavisualization.
FCMappers! The Work of Edward Tufte and Graphics Press. Graphics Press LLC P.O.
Box 430 Cheshire, CT 06410 800 822-2454 Edward Tufte is a statistician and artist, and Professor Emeritus of Political Science, Statistics, and Computer Science at Yale University. He wrote, designed, and self-published 4 classic books on data visualization. The New York Times described ET as the "Leonardo da Vinci of data," and Bloomberg as the "Galileo of graphics. " He is now writing a book/film The Thinking Eye and constructing a 234-acre tree farm and sculpture park in northwest Connecticut, which will show his artworks and remain open space in perpetuity. Topics covered in this one-day course include: A new, widely-adopted method for presentations: meetings are smarter, more effective, 20% shorter. Charlie Park / Data visualization. Graphic Sociology. Cairo, Alberto. (2013) The Functional Art: An introduction to information graphics and visualization.
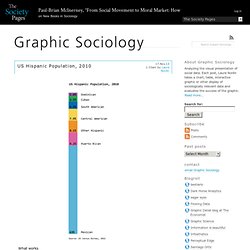
Berkeley: New Riders, a division of Pearson. Overview A functional art is a book in divided into four parts, but really it is easier to understand as only two parts. The first part is a sustained and convincingly argument that information graphics and data visualizations are technologies, not art, and that there are good reasons to follow certain guiding principles when reading and designing them. It is written by Alberto Cairo, a professor of journalism at the University of Miami an information graphics journalist who has had the not always pleasant experience of trying to apply functional rules in organizational structures that occasionally prefer formal rules. The second part of the book is a series of interviews with journalists, designers, and artists about graphics and the work required to make good ones. What does this book do well? Diversity What doesn’t this book do well? Summary.