
Excel – joel matriche. En un sens, il en va du journalisme de données comme des travaux de peinture : avant d’aller à l’essentiel, qui est aussi le plus réjouissant, il faut préparer le chantier, tout décrasser...

Continue reading Sans grande surprise, la fonction SI renvoie une valeur selon qu’une condition est – ou n’est pas – remplie. Elle peut être dopée grâce aux fonctions ET et OU. Voire survitaminée comme un athlète... Continue reading. The Quartz Guide to Bad Data. Photo: Janneke Staaks in Flickr (CC License) This guide was written to help Quartz staff identify problems with data they report on.

After publishing it on GitHub, we heard from folks in many other industries who also found it helpful, so we’re republishing it here for the benefit of all Quartz readers. The most up-to-date version of this guide can always be found on GitHub. An exhaustive reference to problems seen in real-world data along with suggestions on how to resolve them. As a reporter your world is full of data. Most of these problems can be solved. You cannot possibly review every dataset you encounter for all of these problems. If you have questions about this guide please email Chris.
Index (scroll down for detailed list of problems) Issues that Your Source Should Solve Issues That you Should Solve Issues a Third-Party Expert Should Help You Solve Issues a Programmer Should Help You Solve. Des tutoriels faits par et pour des journalistes. Power Query: Importer, transformer et fusionner des tables de données dans Excel.
Excel 2013 offre de nombreuses possibilités pour construire des bases de données plus aisément.

L’une d’entre elles est le Add-in Power Query, qui permet notamment d’importer, de transformer et de fusionner des tables de données. Cet add-in existe aussi pour Excel 2010 mais il me semble plus performant en 2013. Installation de Power Query Notez que vous devez d’abord vous rendre dans les options Excel (menu Fichier/File), choisir l’option Add-ins et activer Power Query, dans les COM Add-ins. Par la suite, vous verrez apparaître le menu Power Query, dans votre barre de menus. Importation de tables de données Power Query vous permet d’importer des tables de données de diverses sources (Excel, Texte, CSV, My SQL, Web, Oracle, IBMDB2 etc.).
How To Use Simple Excel Functions for Data Analysis. In this series of video tutorials, ICIJ reporter Kate Willson demonstrates four basic yet essential Excel functions to assist with data analysis during investigative reporting.

Want to see any other video tutorials about Computer-Assisted Reporting? Please let us know either in the comments below or at contact@icij.org. Interested in viewing more of our investigative reporting video tutorials? Subscribe to ICIJ's YouTube channel to be the first to know when they are released. Auto Fill We use Excel's "Auto Fill" function all the time when preparing data for analysis. Sorting and Filtering Sorting and Filtering are great and easy ways to look at your data. Concatenation Using Excel to join data from multiple cells is a powerful tool -- particularly if you're writing lengthy SQL queries. Pivot Tables You don't always need a complex SQL query to analyze data. Thanks for watching. Using Excel to do precision journalism, an Update from the School of Data Journalism in Perugia.
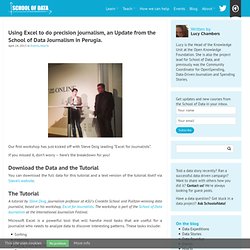
Our first workshop has just kicked off with Steve Doig leading “Excel for Journalists”.

If you missed it, don’t worry – here’s the breakdown for you! Download the Data and the Tutorial You can download the full data for this tutorial and a text version of the tutorial itself via Steve’s website. The Tutorial A tutorial by Steve Doig, journalism professor at ASU's Cronkite School and Pulitzer-winning data journalist, based on his workshop, Excel for Journalists.
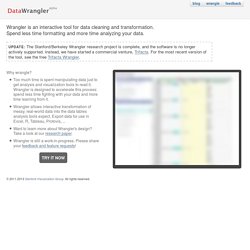
Microsoft Excel is a powerful tool that will handle most tasks that are useful for a journalist who needs to analyze data to discover interesting patterns. Data Wrangler. UPDATE: The Stanford/Berkeley Wrangler research project is complete, and the software is no longer actively supported.

Instead, we have started a commercial venture, Trifacta. For the most recent version of the tool, see the free Trifacta Wrangler. Why wrangle? Too much time is spent manipulating data just to get analysis and visualization tools to read it. Wrangler is designed to accelerate this process: spend less time fighting with your data and more time learning from it.
Grabbing Twitter Search Results into Google Refine and Exporting Conversations into Gephi. Originally published by Tony Hirst on blog.ouseful.info under a Creative Commons Attribution licence.

How can we get a quick snapshot of who’s talking to whom on Twitter in the context of a particular hashtag? Here’s a quick recipe that shows how… First we need to grab some search data. The Twitter API documentation provides us with some clues about how to construct a web address/URL that will grab results back from a particular search on Twitter in a machine readable way (that is, as data): is the base URL, and the format we require is json, which gives us The query we want is presented using the q= parameter: If we want multiple search terms (for example, library skills), they need encoding in a particular way.