
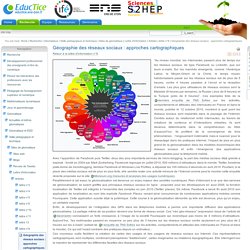
Bibliométrie. Accueil. Géographie des réseaux sociaux : approches cartographiques. Retour à la lettre d'information n°8 “Au niveau mondial, les internautes passent plus de temps sur les réseaux sociaux, de type Facebook ou LinkedIn, que sur leurs e-mails.
Sur les marchés émergents, comme l’Amérique Latine, le Moyen-Orient et la Chine, le temps moyen hebdomadaire passé sur les réseaux sociaux est de plus de 5 heures, contre 4 heures passées à l’envoi et la réception d’emails. Les plus gros utilisateurs de réseaux sociaux sont la Malaisie (9 heures par semaine), la Russie ( plus de 8 heures) et la Turquie (près de 8 heures)”. Ces exemples tirés de la dernière enquête de TNS Sofres sur les activités, comportements et attitudes des internautes en France et dans le monde, publiée le 12 octobre 2010, montrent à quel point les réseaux sociaux sont implantés dans le paysage de l’Internet. Centrés autour du relationnel entre internautes, au travers de créations de contenus et d’interactions virtuelles, ils sont devenus déterminants dans la compréhension du Web d’aujourd’hui. Réseaux sociaux, publications scientifiques et libre accès - un rapport de l'Université de Nottingham.
Reseaux sociaux. Toute la semaine qui vient, je vais coordonner avec Julie Pagis le module « Analyse des réseaux » de Quantilille 2013, la fameuse école d’été qui depuis de très nombreuses années a beaucoup contribué à la diffusion des méthodes quantitatives dans les sciences sociales.
Le module commence jeudi matin, et je me suis dit qu’il n’y avait aucune raison de réserver les ressources rassemblées pour cette occasion à la vingtaine de collègues privilégiés dont la canditature a été retenue. Je vais donc m’efforcer, avec l’aide des intervenants, au fur et à mesure de cette école d’été, de partager avec vous notes de cours, powerpoints, modes d’emploi, voire jeux de données… Pour que vous ayez une idée des bonnes choses à venir, voici déjà le programme détaillé de cette école d’été consacrée à l’analyse des réseaux… En attendant la bibliographie, un panorama des logiciels et une liste de ressources électroniques utiles dans les billets suivants… bibliographie / powerpoint / notes de cours Présentation.
MODELESPACE. PortailSIG Python : transformer shapefile en un réseau topologique (graphe) Comment transformer un shapefile, format sans topologie, en un réseau topologique (topologie de réseau, voir la topologie dans « GRASS GIS : géométries, topologies et conséquences pratiques (vecteurs, rasters, volumes) ») de noeuds et d'arcs ou d'arêtes, c'est à dire un graphe mathématique ?
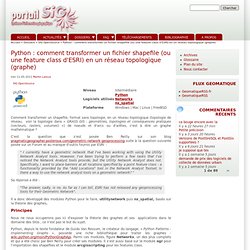
C'est la question que s'est posée Ben Reilly sur son blog pragmaticgeographer.posterous.com/geometric-network-geoprocessing suite à la question suivante posée sur un Forum et au manque d'outils fournis par ESRI : " I currently have a geometric network that I've been working with using the Utility Network Analyst tools. However, I've been trying to perform a few tasks that I've noticed the Network Analyst tools provide, but the Utility Network Analyst does not. Specifically, I want to place barriers at all locations specified by a point feature class - a functionality provided by the "Add Locations" tool in the Network Analyst Toolset.
ArcGIS Network Analyst. Python-graph - A library for working with graphs in Python. PostGIS.fr - Le site de la communauté des utilisateurs francophones de PostGIS – PostGIS.fr. Networks / Pajek. yEd - Graph Editor. yEd is a powerful desktop application that can be used to quickly and effectively generate high-quality diagrams.
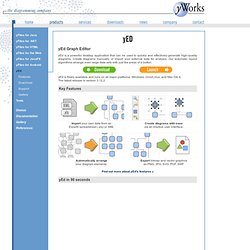
Create diagrams manually, or import your external data for analysis. Our automatic layout algorithms arrange even large data sets with just the press of a button. yEd is freely available and runs on all major platforms: Windows, Unix/Linux, and Mac OS X. The latest release is version 3.12.2 Key Features Import your own data from an Excel® spreadsheet (.xls) or XML Create diagrams with easevia an intuitive user interface. Automatically arrangeyour diagram elements. Export bitmap and vector graphicsas PNG, JPG, SVG, PDF, SWF yEd in 90 seconds Supported Diagrams yEd supports a wide variety of diagram types. Support Resources The yEd online support resources include the yEd Graph Editor manual and the yEd forum where you can give us feedback. Gephi, an open source graph visualization and manipulation software. Q-analysis. Data Visualization Software. Bibliography(bib) Peer-reviewed article Titre PORGY: A Visual Graph Rewriting Environment for Complex Systems Auteurs Bruno Pinaud ; Guy Melançon; Jonathan Dubois Identifiant hal-00682550 Accès au bibtex Proceeding with peer review Topological Decomposition and Heuristics for High Speed Clustering of Complex Networks Faraz Zaidi ; Guy Mélançon hal-00679668 Accès au texte intégral et bibtex Research report Generating Artificial Social Networks with Small World and Scale Free Properties ; Arnaud Sallaberry; Guy Melançon.

Tulip Software Documentation.