
Data visualization. Data visualization or data visualisation is viewed by many disciplines as a modern equivalent of visual communication.
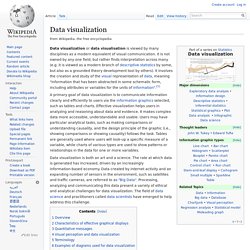
It is not owned by any one field, but rather finds interpretation across many (e.g. it is viewed as a modern branch of descriptive statistics by some, but also as a grounded theory development tool by others). It involves the creation and study of the visual representation of data, meaning "information that has been abstracted in some schematic form, including attributes or variables for the units of information".[1] A primary goal of data visualization is to communicate information clearly and efficiently to users via the information graphics selected, such as tables and charts. Effective visualization helps users in analyzing and reasoning about data and evidence. It makes complex data more accessible, understandable and usable.
Data visualization is both an art and a science. Overview[edit] Indeed, Fernanda Viegas and Martin M. Graphics reveal data. Terminology[edit] Visualizing.org. Crowdmap. Crowdmap allows you to set up your own deployment of the Ushahidi Platform without having to install it on your own web server.
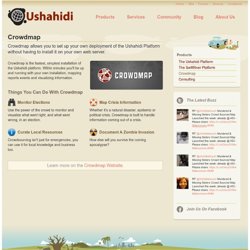
Crowdmap is the fastest, simplest installation of the Ushahidi platform. Within minutes you'll be up and running with your own installation, mapping reports events and visualizing information. Things You Can Do With Crowdmap Monitor Elections Use the power of the crowd to monitor and visualize what went right, and what went wrong, in an election. Map Crisis Information Whether it's a natural disaster, epidemic or political crisis, Crowdmap is built to handle information coming out of a crisis. Curate Local Resources Crowdsourcing isn't just for emergencies, you can use it for local knowledge and business too. Document A Zombie Invasion How else will you survive the coming apocalypse?
Learn more on the Crowdmap Website . Geek to Live: Roll your own timeline. IMPURE. Mind Mapping. A mind map is a diagram used to visually organize information.
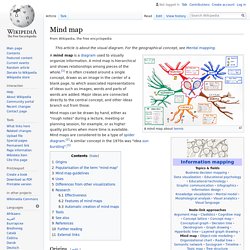
A mind map is hierarchical and shows relationships among pieces of the whole.[1] It is often created around a single concept, drawn as an image in the center of a blank page, to which associated representations of ideas such as images, words and parts of words are added. Major ideas are connected directly to the central concept, and other ideas branch out from those. Mind maps can be drawn by hand, either as "rough notes" during a lecture, meeting or planning session, for example, or as higher quality pictures when more time is available. Mind maps are considered to be a type of spider diagram.[2] A similar concept in the 1970s was "idea sun bursting".[3] Origins[edit] The semantic network was developed in the late 1950s as a theory to understand human learning and developed further by Allan M.
Popularisation of the term "mind map"[edit] Mind map guidelines[edit] Buzan suggests the following guidelines for creating mind maps: Family Tree - Free Family Trees and Family History. Gramps. Mind Map Art. Death and Taxes. Mind42. Connected Mind. Dropmind. Knowledge Genes - The WHY Code. TheBrain. Biggerplate - the mind map library. TagCrowd: make your own tag cloud from any text.