
Fixed positioning in Mobile Safari. View Source from Safari on iPad - rob’s blog. UPDATE: Thank you to Rixtur for the update for iOS 6.
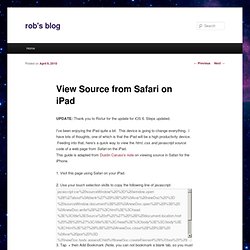
Steps updated. I’ve been enjoying the iPad quite a bit. This device is going to change everything. Our Mobile Planet. Usage share of web browsers. Most used web browser by country as of February 2014 according to StatCounter.
The usage share of web browsers is the proportion, often expressed as a percentage, of visitors to a group of websites that use a particular web browser. Web browser usage share varies from region to region as well as through time. Accuracy[edit] AdMob Metrics. The Report: Malaysia 2010. Half of Public Wi-Fi Connections Aren't From Laptops [STATS] Mobile ad network JiWire just released the stats from its latest public Wi-Fi study and found that 56% of connections are from mobile devices like the iPhone, the iPod touch, Android smartphones and Sony's PSP handheld gaming console.
![Half of Public Wi-Fi Connections Aren't From Laptops [STATS]](http://cdn.pearltrees.com/s/pic/th/public-connections-laptops-2233612)
JiWire serves ads through public Wi-Fi spots in places like airports, coffee shops and hotels. Last year it published another interesting stat: Just shy of 98% of mobile devices that connect to public Wi-Fi are made by Apple. The iPod touch and iPhone took 55.95% and 41.7%, respectively. Those numbers have slipped slightly since then, with Google Android devices passing Sony's PSP to take the third-place spot on the list. Public Wi-Fi hotspots grew in ubiquity by 21.9% in 2009, and about half of public Wi-Fi spots are free. Worldometers - real time world statistics. Mapping the growth of the internet.
The beauty of mobile is more than just looks. Research by TNS reveals content and apps are rising in importance as the reasons for buying a new mobile phone, but brands must match new social technology with usability and appearance.

Mobile phone applications have the potential to redefine the way consumers view and purchase mobile devices - as well as the brands that advertise on them. A new report suggests that marketers should take note of apps because they may well become the future of how consumers interact with phones. The annual TNS Technology Global Telecoms Insights study looks at how 27,000 consumers around the world are using their phones. Thirteen per cent of people already consider content and apps to be the single most important factor in their next mobile purchase decision. More traditional measures of mobile phone desirability, such as the brand or network, are now the most important factor for just 12% of respondents. Just having the latest, greatest app isn’t allimportant to people, however.
10 Outstanding Social Media Infographics. Nobody has time to read anymore, right?

Every day we are all inundated with more and more information overload coming from credible and yet to be verified sources. Where can Internet users find relief? Answer: the infographic. Facebook Statistics by country - Facebakers. Twitter on Paper. What Social Media Users Want [STATS] Twitterers mostly consume news, MySpace users want games and entertainment, Facebookers are into both news and community and Digg's audience has a mixed bag of interests.
![What Social Media Users Want [STATS]](http://cdn.pearltrees.com/s/pic/th/what-social-media-users-stats-2546191)
This is all according to online advertising network Chitika, who set out to analyze the interests of MySpace, Facebook, Twitter and Digg users by comparing the genres of sites that receive traffic from these social networks. 287,090 impressions were used in the report, and based on this research, each social site has a distinct makeup of users with unique tastes. The graphic below breaks it down. What's most interesting is that nearly half the traffic (47%) that Twitter generates falls into the news category.
In fact, Twitter users' interest in the news genre surpasses that of Facebook users by nearly 20%, which would appear to make it the number-one social network for newsies. The Current State of Twitter [INFOGRAPHIC] Muhammad Saleem is a social media consultant and a top-ranked community member on multiple social news sites.
![The Current State of Twitter [INFOGRAPHIC]](http://cdn.pearltrees.com/s/pic/th/current-twitter-infographic-2534650)
Follow him on Twitter for more social media insights. There is no doubt that Twitter has been a runaway success. Add to their rapid growth the recently announced @anywhere platform, and plans for further international expansion, and it comes as no surprise that the company is not looking to sell — at least within the next 2 years. A Year of 3G in Vietnam: How Attracting the Young Can Accelerate Growth. Melissa Panganiban, Associate Director - Consumer Research, The Nielsen Company First launched in Japan in 2001, the speed of Third Generation ("3G") networks have changed the way consumers use mobile phones, extending them beyond calls and simple text messages to mobile video viewing, Internet browsing and other data-intensive functions not previously available on older, slower networks. 3G rolled out across Vietnam in 2009, and The Nielsen Company used the anniversary of its launch as a check point to survey consumers’ attitudes and assess market awareness of the technology as well as examine the challenges facing mobile service providers in attracting customers to their networks.

Facebook-viz-big.jpg (900×2451) The Apple iPad, one year later. Mobile-market-share.gif (1600×967) IE6 Countdown. Browser Market Share Chart.
Top 9 Mobile Browsers from Jan 09 to Feb 10. Who's scanning all these QR codes? It was predicted that QR codes would blow up this year.

And they were right. You can’t look at a newspaper, poster, or cereal box anymore without stumbling upon one of the black and white scannable squares. But just because you see one, doesn’t mean you’ll pull out your phone and scan it. Web Browser Performance.