
Facebook Security Improvements Coming Soon: Trusted Friends And Application Passwords. Facebook announced two new features to help improve security for its 800 million-plus users: trusted friends, and application passwords.

If you’ve ever left a set of keys with a close friend who lives nearby, in case yours are lost, the concept of trusted friends will be familiar to you. The social network will let users choose three to five friends to contact if they are ever locked out of their Facebook accounts. Codes will be sent to those friends, and users can regain access to their accounts with those codes. As for application passwords, rather than accessing Facebook apps with their credentials via the social network, users can elect to specify separate passwords for apps. To do this, users must go to account settings, click the security tab, and enter the app passwords section. Facebook said trusted friends and app passwords will be rolled out to users “in the coming weeks.” Meanwhile, Facebook has this to say about trusted friends and app passwords:
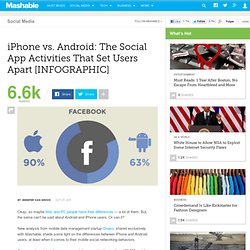
iPhone vs. Android: The Social App Activites That Set Users Apart. Okay, so maybe Mac and PC people have their differences — a lot of them.

But, the same can't be said about Android and iPhone users. Or can it? New analysis from mobile data management startup Onavo, shared exclusively with Mashable, sheds some light on the differences between iPhone and Android users, at least when it comes to their mobile social networking behaviors. Onavo analyzed data from a representative sample of more than 100,000 mobile owners, and looked at more than 40 terabytes of anonymized mobile data over a 30-day period.
The startup discovered some interesting tidbits. "The social networking activity on mobile clearly differs according to which mobile you have," Onavo CEO Guy Rosen tells Mashable. In case you're wondering, the usage percentages in the infographic below show what percentage of iPhone and Android populations use the social apps over mobile networks, and the mobile data usage ratios represent the average MB per user, per app, per month.
Inside the mind of a Community Manager. Profile of Android vs iOS Users [Infographic] Wonder what differences between iOS vs Android users are?
![Profile of Android vs iOS Users [Infographic]](http://cdn.pearltrees.com/s/pic/th/profile-android-infographic-14923943)
What about their personality traits and preferences in things like fashion, food, media consumption, technology, and politics? Or how about general life experience and spending habits? Stereotypes abound in this giant iOS vs Android user profile infographic, and it covers a wide variety of data that spells out the differences between the average iOS user and Android user. Whether you believe the data or not, it’s an interesting look at the smartphone and tablet OS wars. Full infographic below (it’s huge): 10 amazing e-commerce infographics. I've rounded up ten recent infographics on e-commerce and related issues, including delivery, social commerce, and how the use of colour affects purchase habits.

Where possible, I've added the infographics to this post in a readable size, but for others you can click on the image to see a larger version... Online shopping around the world (via Pod1) What are people really buying online? (via Buysight) How big is e-commerce? Online shopping in the UK (via giveasyoulive) How does colour affect purchases? Small businesses and e-commerce (via Formstack) The state of social commerce (via Socialcommerce) Shipping and e-commerce (via xemiom) US e-commerce trends (via bitwizards) Seven reasons people fear e-commerce (via refresh)