
A lightweight JavaScript graph drawing library. The Lightbox Clones Matrix. For Protovis Users. D3 and Protovis have the same primary author (Mike Bostock), so it’s not surprising that these two systems take a similar approach to visualization.
However, there are plenty of important differences, too; enough that it made sense to start anew, rather than patching the design of Protovis. Many of these changes were influenced by observing users’ successes and struggles with past approaches. D3 and Protovis also share the same goal: to enable you, the web developer (however experienced you may be), to build custom visualizations in the browser with a minimum amount of effort.
Not “zero” effort, certainly—but at least to alleviate the repetive burden of common tasks, while retaining the expressiveness needed for custom designs. D3 is not a charting library! Where D3 and Protovis differ is the type of visualizations they enable (the what), and the method of implementation (the how). So, What’s Different? JavaScript InfoVis Toolkit. Highcharts - Interactive JavaScript charts for your webpage. JavaScript Augmented Reality – JavaScript Augmented Reality – Bocoup Web Log. Augmented Reality: using JSARToolkit with WebGL & HTML5 Video Last week I spent some time running tests and generally familiarizing myself with the JSARToolkit code.

I also built a JavaScript wrapper for the library to make it easier to use. JSARToolkit is a JavaScript library converted from FLARToolkit (Flash), and is developed for tracking AR Markers in video footage. The ARToolkit converts the data from the markers into 3D coordinates with-which you can super-impose images and other 3D or 2D content. What is Augmented Reality?
"Augmented reality (AR) is a term for a live direct or an indirect view of a physical, real-world environment whose elements are augmented by computer-generated sensory input, such as sound or graphics. You may have already seen JSARToolkit in action on Ilmari Heikkinen’s awesome “Remixing Reality” demo. Resources: JSARToolkit-Wrapper on Github You will need the latest version of Firefox 4 or Chrome to see these demos working. HTML5 Music-Video Research. MooWheel: a javascript connections visualization library. View the project on Google Code 06.29.2008 version 0.2 now available!

Get it. What's new? Looking for version 0.1 instead? The purpose of this script is to provide a unique and elegant way to visualize data using Javascript and the <canvas> object. This type of visualization can be used to display connections between many different objects, be them people, places, things, or otherwise. This script requires three libraries to support it. MooWheel only requires 2 arguments to create a basic wheel graph. New MooWheel(dataArray, canvasElement); The canvas element can be passed as either an element reference or an id string.
Note: In this context, the first argument (the data parameter), doesn't matter. Raphaël—JavaScript Library. JqPlot Charts and Graphs for jQuery. Popcorn Build Tool. Making video work like the web. The HTML5 Media Framework.
Processing.js. D3.js - Data-Driven Documents. Anvaka/VivaGraphJS. Graph Visualization and Neo4j. So far we’ve learned how to get Neo4j up and running with Neography, how to find friends of friends and degrees of separation with the Neo4j REST API and a little bit of the Gremlin and Cypher languages.
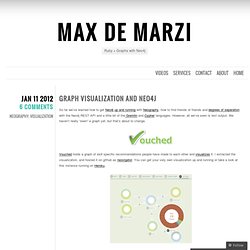
However, all we’ve seen is text output. We haven’t really “seen” a graph yet, but that’s about to change. Vouched holds a graph of skill specific recommendations people have made to each other and visualizes it. I extracted the visualization, and hosted it on github as neovigator. You can get your very own visualization up and running or take a look at this instance running on Heroku. Let’s get it up and running and then we’ll go through some pieces of the code. Then visit localhost:9292 to see it running. The website is a Sinatra Application with only two routes. The JSON object we create will have this structure: When we fill this JSON object and pass it to the visualization, this is what we get: We create a route in Sinatra and set it to return JSON. Update! Jsviz - JSViz makes it easy to create dynamic 2D views of information.
Dracula Graph Library.