
Maps Identify Fallout and Radiation Hotspots from Japan Nuclear Disaster. By Edwin Cartlidge of Nature magazine The distribution of fallout from the crippled Fukushima Daiichi nuclear power plant has now been mapped by two independent teams.
The charts reduce the uncertainty surrounding the amount of contamination across Japan, and help to show which areas should be safe to return to farming. The accident at Fukushima occurred after a magnitude-9 earthquake and subsequent tsunami hit northeastern Japan on March 11. The disasters knocked out the plant's cooling system, causing several reactors to melt down and huge amounts of radioactive material to be emitted. One of the radionuclides released was cesium-137, which has a half-life of 30 years and poses a long-term health risk if absorbed by the soil in significant quantities. Japan-wide maps of soil concentrations of the radionuclide cesium-137 can help the government to work out which areas are likely to be safe for farming. Two studies have now used different methods to map the fallout over larger areas. Fukushima/Tokyo - Low Level Radiation « rchoetzlein - Theory. * Note: I’m pleased to announce a new animated graphic of Fukushima radiation regional effects.
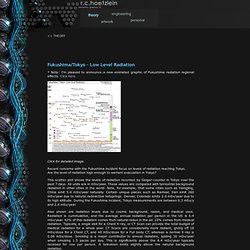
Click here. Click for detailed image. Map of Radiation Measurements by Greenpeace team. Japan Status. #geigermaps. Safecast. RDTN.ORG. 'Citizen Scientists' Crowdsource Radiation Measurements In Japan : Shots - Health Blog. Hide captionA cluster of radiation reading mapped by RDTN.org RDTN.org A cluster of radiation reading mapped by RDTN.org Marcelino Alvarez was getting frustrated and a little paranoid last week as he watched news reports about radiation levels in Japan and plumes drifting across the Pacific.
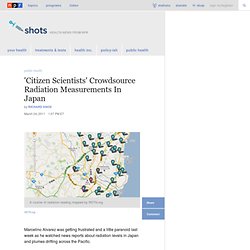
"There were a lot of talking heads speculating about how this could happen or that could happen," says Alvarez, a Web developer, news fiend and all-around data junkie. "But not a lot of facts. " Alvarez got an idea: Enlist an army of citizen scientists to buy Geiger counters — they're advertised online for several hundred dollars — and send radiation measurements to a website for posting and continual updating. "We thought there was something noble to the notion of having people purchase their own detection devices and post data," Alvarez says. By last Saturday the Portland, Ore. Is this a good idea? I put the question to a couple of experts in radiation detection and analysis. UNOSAT supports crowd sourcing community. Geneva 14 March 2011.
The aftermath of the catastrophic quake and tsunami in Japan has mobilised unprecedented participation from social networks and crowd sourcing communities around the world. Satellite imagery released for free by major commercial satellite companies earlier this week revealed to the world the extent of the impact of the tsunami waves that hit the east coast of Japan on Friday 11 March. Japan is using various satellite sensors and is coping with the technical work necessary to turn this large amount of data into useful information for rescue and rehabilitation operations.
Japan possesses all the technical and scientific capacity necessary to handle satellite mapping and it is a space power itself. For this crisis the role of emergency mapping from entities outside Japan is limited but still useful as a source of additional information and adds a powerful visualisation dimension accessible to the general public worldwide.
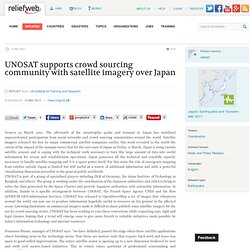
Satellite images show tsunami-ravaged Japan coast: Scientific American Gallery. When devastation extends as far as the human eye can see, digital eyes in the sky can provide essential information for emergency response efforts.
These satellite images show the town of Soma (red dot) and surrounding area on Japan's northeastern coast as they appeared on September 5, 2010, [left] before the March 11, 2011, earthquake and tsunami, and on the day after. On the heels of the earthquake, tsunami heights of 7.3 meters were reported in Soma. A day later floodwaters stretched several kilometers inland. Soma is a port village of 38,000 people located about 150 kilometers southwest of the magnitude 9.0 quake's epicenter and 40 kilometers north of the stricken Fukushima Daiichi nuclear power plant. As of March 20, more than 100 residents of Soma have been confirmed dead. —Nina Bai. Google Crisis Response. Prefectures of Japan. Prefectures of Japan The chief executive of each prefecture is a directly-elected governor (知事, chiji?).
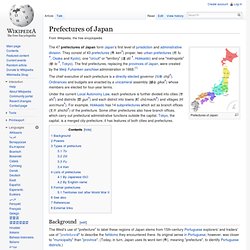
Ordinances and budgets are enacted by a unicameral assembly (議会, gikai?) Whose members are elected for four-year terms. Under the current Local Autonomy Law, each prefecture is further divided into cities (市, shi?) And districts (郡, gun?) Background[edit] The West's use of "prefecture" to label these regions of Japan stems from 15th-century Portuguese explorers' and traders' use of "prefeitura" to describe the fiefdoms they encountered there.
Those fiefs were headed by a local warlord or family, and despite that those fiefs have long since been dismantled, merged, and reorganized numerous times over, and given legislative governance and oversight, the rough translation stuck. In 2003, then-Prime Minister Junichiro Koizumi proposed that the government consolidate the current prefectures into about 10 regional states. Powers[edit] Japan is a unitary state. ESRI Japan Earthquake. Nuclear Impact. Japan Quake Map. Texas Tech - Japan Earthquake. Japan Quake Map.