Zoom
Trash

SSASDiag: A Tool To Help Diagnose Analysis Services Problems « Chris Webb's BI Blog. There are a lot of great community-developed tools out there for Analysis Services developers to use (BI Developer Extensions, DAX Studio, Tabular Editor, Analysis Services Query Analyzer to name a few) and they have saved me vast amounts of time and effort over the years.
When I joined Microsoft last month I came across one which I had never seen before but which is nevertheless quite mature and feature-rich: the SSAS Diagnostics Tool or SSASDiag for short. It’s available on GitHub here: …and you can read the documentation here: It’s an open source tool developed by the people who support Analysis Services here at Microsoft and is intended to help them collect and analyse the information they need to troubleshoot on-premises SSAS issues, but it’s available for anyone to use. SSASDiag: A Tool To Help Diagnose Analysis Services Problems « Chris Webb's BI Blog. DAX Studio – What do all those numbers mean in the server timing output? How to Make DAX Distinct Counts 100x Faster with Exact Match Aggs — Artis Consulting. My wife says that if I wait long enough, some of my clothing will come back into fashion.
In the data analytics world, apparently we have waited long enough because an old Analysis Services Multidimensional concept called aggregations has come back into fashion. You may have seen announcements that Power BI supports its own flavor of aggregations now. This blog post is not about Power BI aggs. However, I’ll explain why we didn’t use them and then I’ll describe the approach we did take. The Business Scenario To provide some context for the real client scenario where we created this exact match agg approach, the client is a retailer and they tend to measure themselves on a per store per day scale as many retailers do.
I was presented with this very situation where a distinct count over an 18 billion row table was the denominator for most calculations and performance was terrible. Separate business names from technical names using SSAS and Power BI - Kasper On BI. New memory options for Analysis Services. We’re happy to introduce some new memory settings for Azure Analysis Services and SQL Server Analysis Services tabular models.
These new settings are primarily for resource governance, and in some cases can speed up data refresh. IsAvailableInMdx The IsAvailableInMdx column property is available in Azure Analysis Services and SQL Server Analysis Services 2017 CU7. It prevents building attribute hierarchies, reducing memory consumption. This means the column is not available for group-by queries to MDX clients like Excel. This property can also improve performance of refresh operations; particularly for tables with lots of partitions.
Using Excel & PowerShell to organize and deploy DAX measures – Fredrik Hedenström. Organizing and keeping track of your DAX measures in a tabular model can be a challenging task, especially when working with larger Analysis Services projects.
Visual Studio does not give you much help in organizing them and it is easy to end up with a messy model where code is duplicated among measures. Excel and PowerShell to the rescue! An alternative approach from keeping your DAX measures within your Analysis Services project would be to store them in well-structured Excel document(s) instead. Such an Excel document could be structured in the following way: The following metadata (columns) are used to describe the DAX measure: MeasureName – the name of the measure.DAXFormula – the full DAX expression that is used to calculate the measure.Format – the formatting formula that should be applied to the measure (if any).VirtualTable – the name of the table (a virtual table that should not exist in the model) that the measure should be placed in. This is where PowerShell comes into play. SSASQueryAnalyzer.
Multi-Source partitioned Azure Analysis Services tables – cold data from Azure Data Lake Store, hot data from Azure SQL Database – Jorg Klein's Blog. Modern data analytics platforms often follow a hub and spoke architecture in which a data hub is used as central data ingestion area that contains all data, usually in raw format.
Data spokes deliver data to the majority of the end users in a data store that meets their specific requirements. The data hub can be build on Azure Data Lake Store (ADLS) and/or Azure SQL Data Warehouse. Data spokes can basically come in any form, dependent on the specific requirements. SSAS Tabular 2016 Metadata Reporting – Insight Quest. The following Excel workbook available for download contains 10 report pages to describe primary components of SSAS Tabular 2016 databases at the 1200 compatibility level: SSAS Tabular 2016 Metadata Reporting Download How to use this file: 2.
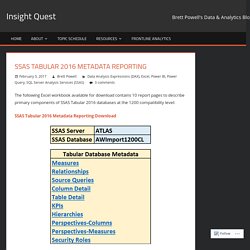
Identify the SSAS 2016 Tabular Server your database is deployed to and the name of the database. 3. In a few seconds, the report pages linked from the Selection page should reflect your Tabular 2016 (1200 CL) database. What’s new in SQL Server 2017 RC1 for Analysis Services. The RC1 public preview of SQL Server 2017 is available here!
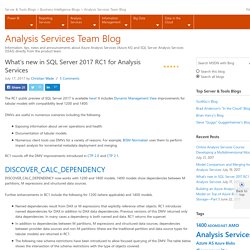
It includes Dynamic Management View improvements for tabular models with compatibility level 1200 and 1400. DMVs are useful in numerous scenarios including the following. Exposing information about server operations and health.Documentation of tabular models.Numerous client tools use DMVs for a variety of reasons. Model Comparison and Merging for Analysis Services. LASTNONBLANK Explained - Excelerator BI. MDX – Tomislav Piasevoli – BI Blog. Chris Webb recently blogged about a strange phenomenon regarding sets in where clause and auto-exists.
Today it occured to me that I had experienced a similar issue while doing some testing a year from now. A quick search on the right words (Tomislav Darren set slicer) and the exact thread popped up first in SSAS forum search engine. After I’ve read it, I was very much intrigued by Chris’ post, so I’ve read it and tested it too, and then decided to spend few hours in order to find out what’s going on in the examples he provided, hoping to discover a general rule of this “weird” behavior and, most of all, the answer “why”. Whether I succeeded or not, I’ll leave up to you. The explaination follows. First, let’s make the summary of facts. Here is the list of queries, how the MDX looks like, what do they return (not values, we focus on members), as well as short description of behavior/mechanism behind. select [Measures]. select [Measures]. select [Measures]. select [Measures]. select [Measures].
SSAS 2016 Locking Improvements – Chris Webb's BI Blog. I first became aware of the server-wide lock taken out by SSAS when processing finishes – and the issues that this can cause – from this blog post by Andrew Calvett back in 2009.
More information on how locking works in SSAS can be found in chapter 26 of “Microsoft SQL Server 2008 Analysis Services Unleashed”, while the most comprehensive discussion of this topic can be found in this post by Jason Howell: Over the years I’ve worked with several customers who have run into locking problems as a result of users querying while processing or synchronisation are taking place, so as a result I was interested to read the following paragraph in the white paper on “Automated Partition Management For Analysis Services Tabular Models” that was published a few months ago: Azure Analysis Services Backup and Restore. This post is authored by Bret Grinslade, Principal Program Manager and Josh Caplan, Senior Program Manager, Azure Analysis Services.
We have gotten good feedback from customers and partners starting to adopt Azure Analysis Services in production. Based on this feedback, this week we are releasing improvements around pricing options, support for backup and restore, and improved Azure Active Directory support. Please try them out and let us know how they work for you. DAX Time Intelligence Explained - Excelerator BI. Using Process Add in tabular models - SQLBI. This article describes how to implement incremental updates to an Analysis Services database in Tabular mode with compatibility version 1200 or higher. In Analysis Services you can process a table in a tabular model using several techniques: you can process the whole table, you can split the table in several partitions and process a single partition, you can merge partitions, and you can incrementally process a single partition by using ProcessAdd.
This article is an updated version of the original Incremental Processing in Tabular using Process Add, which is still valid if you have to manage tabular models in compatibility version between 1050 and 1103. The techniques described in this article can be applied only to model compatibility levels 1200 or higher. It is out of scope of this article describing how you should define the SQL command that only returns the new rows to be added to the table in a tabular model. Where Azure Analysis Services Fits Into BI & Analytics Architecture (Part 3) — SQL Chick. This is part 3 of a discussion about a new service in Microsoft Azure: Azure Analysis Services. Azure AS is a Platform-as-a-Service (PaaS) offering which is in public preview mode (as of December 2016).
Part 1: Why a Semantic Layer Like Azure Analysis Services is Relevant. Creating Custom Table in SSAS Tabular using Table and Row Constructors in DAX. A while ago I was working on a Power BI project which the customer wanted to define a new table directly in the model. The easiest way to achieve this in Power BI Desktop is to “Enter Data” which creates a new table by typing or pasting in new contents. I was thinking of that project the other day and thought, hey, how we can do the same in SSAS Tabular when there is no Power Query (M) language available in SSAS Tabular 2016. The good news is that Power Query will be available in the next version of SSAS Tabular in SQL Server vNext.
But, until then a workaround would be entering data to a CSV file then load it to the model. Another way is to implement custom tables in DAX in SQL Server 2016 Tabular models using Table and Row Constructors. If don’t already have SQL Server 2016 it’s probably time to download and install it. Total Internet SalesInternet Sales in 2014Total Number of Internet Sales Transactions. Showing December to December to see opening values for a year in SSAS/MDX – Purple Frog Systems. I came across an interesting MDX challenge this week; within a cube’s Date dimension, how to show December twice, once where it should be and again as the opening value for the following year. i.e. for each year I need to show Dec (prev yr), Jan, …, Nov, Dec.
Why? Well if you consider the following pivot chart, you can clearly see growth from Jan to Feb, Feb to Mar, etc., but it’s very difficult to see the growth between Dec and Jan. So to make things easier to a user we want to repeat the Dec value and insert it before Jan as an opening value for the year. Now we can’t duplicate December’s data in the DW or Cube for obvious reasons, so we need to create a virtual copy of December using some MDX. Step 1 – Create a new virtual month member called ‘Open’ Week-Based Time Intelligence in DAX - SQLBI. The DAX language provides several Time Intelligence functions that simplify writing calculations such as year-to-date (YTD), year-over-year (YOY) and so on. However, if you have special calendar structure such as 4-4-5 weeks’ calendar, you need to write your custom time intelligence calculation. In this article, you will learn how to write the required DAX formulas. The Time Intelligence functions in DAX (such as TOTALYTD, SAMEPERIODLASTYEAR and many others) assume that every day in a month belongs to the same quarter regardless of the year.
This assumption is not valid in a week-based calendar: each quarter and each year might contain days that are not “naturally” related. For example, January 1st and January 2nd of 2011 belongs to week 52 of year 2010, and the first week of 2011 starts on January 3rd. Consult a cubemember with another cubemember filter. Dynamic security made easy with SSAS 2016 and Power BI – Kasper de Jonge Microsoft BI Blog. Let’s see how row level security (RLS) plays together with the new bi directional relationships. More information on row level security you can find in its own whitepaper here. Both RLS and bi directional relationships work by filtering data. Bi directional relationships explicitly filter data when the columns are actually used on axis, rows, columns or filters in a PivotTable or any other visuals. RLS implicitly filters data based on the expressions defined in the roles. Use Task Scheduler and PowerShell to process your SSAS database – Kasper de Jonge Microsoft BI Blog.
Most of the times you will use SSIS or a SQL Agent job to process a SSAS model, but sometimes you don’t have either one at your disposal. Today we will look at using the regular Windows Task Scheduler and PowerShell to process a partition. What is Azure Analysis Services. #DAX – Joining to a Slowly Changing Dimension. The following is one of the scenarios that I showed during my “Drop your DAX” talk at SQL Saturday #296 in Melbourne. Parameter Table – DAX Patterns. The Parameter Table pattern is useful when you want to add a slicer to a PivotTable and make it modify the result of some calculation, injecting parameters into DAX expressions. To use it, you must define a table that has no relationships with any other table. Creating a Dynamic, Parameterized Measure in DAX. As I continue to explore the many facets of DAX functions, I’m finding more creative ways to add business value and simplify user experiences. Choosing the Right Instance in Perfmon « byoBI.com.
There’s been quite a bit posted on this blog regarding the collection of perfmon counters to monitor Analysis Services instances and troubleshoot performance problems. DAX as a Language - Microsoft Power BI Community. This is a collaborative blog post by @konstantinos and @smoupre resulting from the forum discussion topic “Aggregating Duration/Time”. Introduction. Creating a Dynamic, Parameterized Measure in DAX. Patterns – DAX Patterns. Implementing Column Security with #SSAS Tabular and #DAX. Out of the box Analysis Services (both Tabular and Multi-dimensional) has great support for horizontal or row based security. An example of this is where you would give User1 access to all data where the Country is “Australia” and give User2 access to all data where the country = “United States”. This covers a large percentage of the security requirements that most people have.
But neither technology has great support for vertical or column based security. Microsoft SQL Server Analysis Services 2005/2008 front end client tools, components-SSAS. Handling Data Integrity Issues in Analysis Services 2005. William E. Pearson, III. SQL Server Analysis Services Interview Questions on Dimensions, Hierarchies and Properties. Measures and Measure Groups in Microsoft Analysis Services: Part 2. Measures and Measure Groups in Microsoft Analysis Services: Part 1. MDX functions: SCOPE, THIS and FREEZE.