Use Analyze in Excel + Excel Camera to create PowerPoint magic – Christopher Finlan. So this blog post falls into the “I just think this is cool” bucket.
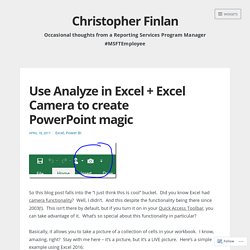
Did you know Excel had camera functionality? Well, I didn’t. And this despite the functionality being there since 2003(!). This isn’t there by default, but if you turn it on in your Quick Access Toolbar, you can take advantage of it. What’s so special about this functionality in particular? Basically, it allows you to take a picture of a collection of cells in your workbook. My table in my Excel workbook looks like this – If I highlight those cells and use the camera tool, I can do the following in my workbook (I normally wouldn’t make the picture this big, but wanted to emphasize it was a picture and not just a linked table) – Now I’ll change the numbers to text. And since it is a picture, I can do all the normal things I could do to a picture in terms of formatting – So could I do something like this with a Pivot Table? Then created my Pivot Table against the data and used the camera tool as I did in my earlier example. Microsoft IT Showcase/Getting started with Excel 2016.
With new chart types and improvements to PivotTables and business intelligence (BI), Microsoft Excel 2016 makes it easier to work with large amounts of data and give it even more meaning.
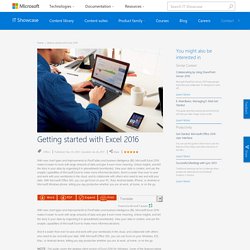
Unlock insights, and tell the story in your data by organizing it in spreadsheets (workbooks). View your data in context, and use the analytic capabilities of Microsoft Excel to make more informed decisions. And it is easier than ever to save and work with your workbooks in the cloud, and collaborate with others who need to see and edit your data. With Microsoft Office 365, you can use Excel on your Windows, iOS, Mac, or Android device, letting you stay productive whether you are at work, at home, or on the go. NOTE: This guide covers the desktop client version of Excel 2016 for Windows.
What’s new Excel 2016 has new features, built so you can do great work with smart tools that help you stay on task. Improved file version history Open a previous version Data analysis enhancements New charts Waterfall. Microsoft Power Query for Excel Help. Note: Power Query is known as Get & Transform in Excel 2016.
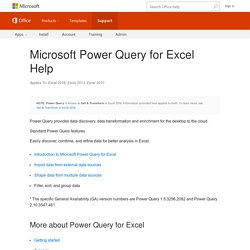
Information provided here applies to both. To learn more, see Get & Transform in Excel 2016. Power Query provides data discovery, data transformation and enrichment for the desktop to the cloud. Standard Power Query features Easily discover, combine, and refine data for better analysis in Excel. * The specific General Availability (GA) version numbers are Power Query 1.5.3296.2082 and Power Query 2.10.3547.461.
More about Power Query for Excel Getting started Microsoft Power Query for Excel provides an intuitive user interface for data discovery, data transformation and enrichment. You can share and manage queries as well as search data within your organization. Implementing Common Calculations In Power Query. When I first saw Data Explorer (as Power Query used to be called), I immediately started thinking of it as a self-service ETL tool; indeed, it’s how Microsoft itself is positioning it.
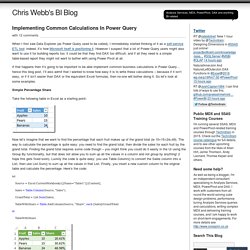
However I suspect that a lot of Power Query users might also want to use it for building reports too: it could be that they find DAX too difficult, and if all they need is a simple table-based report they might not want to bother with using Power Pivot at all. If that happens then it’s going to be important to be able implement common business calculations in Power Query… hence this blog post. I’ll also admit that I wanted to know how easy it is to write these calculations – because if it isn’t easy, or if it isn’t easier than DAX or the equivalent Excel formulas, then no-one will bother doing it. So let’s look at some examples. Simple Percentage Share Take the following table in Excel as a starting point: let Source = Excel.CurrentWorkbook(){[Name="Table1"]}[Content], Sales = Table.Column(Source, "Sales"),
Random Thoughts on Software Development,Data & Business Intelligence… Power BI Download Add-in. Power BI Demo. PowerPivot Videos. Skip to main content SQL Server Sign in United States (English) Home 2014 2012 2008 R2 2008 Previous Versions Library Forums © 2014 Microsoft Manage Your Profile.