Data Visualizations, Challenges, Community. The # infographic Daily. The Italian Blogosphere. [nel mio libro Social Media ROI viene approfondita la tecnica utilizzata] A social network analysis of the Italian blogosphere aimed to understand bloggers’ relationship and how blogosphere is evolving into a complex information ecosystem.
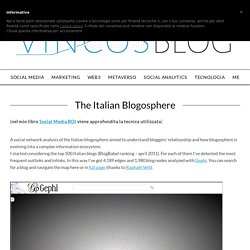
I started considering the top 500 Italian blogs (BlogBabel ranking – april 2011). For each of them I’ve detected the most frequent outlinks and inlinks. Visualising Data. Infographics. Infographics News, a somewhat new BlogSpot blog, has a short list from Ninian Carter of some great infographics of the last year.
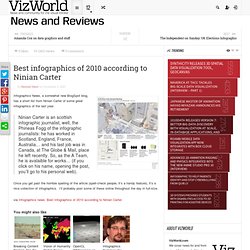
Ninian Carter is an scottish infographic journalist, well, the Phineas Fogg of the infographic journalists: he has worked in Scotland, England, France, Australia… and his last job was in Canada, at The Globe & Mail, place he left recently. So, as the A Team, he is avalaible for works… (if you click on his name, opening the post, you’ll go to his personal web). Once you get past the horrible spelling of the article (spell-check people, it’s a handy feature), it’s a nice collection of infographics. I’ll probably post some of these online throughout the day in full-size. Visual Thinking. The Basics. Places and Spaces. Interactive Infographic of the World's Best Countries.
How The World Spends Its Time Online - VisualEconomics.com. Have you ever wondered how people across the world spend their time online?

Global research firm Nielsen periodically releases data from its studies of consumer behavior online. Here are the 2010 findings regarding social networking, branding and world net usage. Total Time Online The average person spends more than 60 hours a month online. This is the equivalent of 30 straight days a year in front of a computer monitor, smart phone or other internet-capable device. Social networking accounts for 22 percent of the time while 42 percent is spent viewing content, whether watching videos, reading articles or playing online games. Among people who use the Internet, each person visits 2,646 Web pages on 89 domains and logs in 57 times per month.
Most Popular Brands The percentage of all online users that visit Google is 82. Social Network Usage The highest percentage of internet users who log onto social media is in Brazil, with 80 percent using social network sites. Daily Internet Activities. Best graphics of 2010, according to websites. Transparency: GOOD's Most Popular Infographics of 2010 - Design. In the last year, we've released a nearly 100 original infographics.
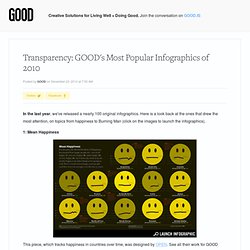
Here is a look back at the ones that drew the most attention, on topics from happiness to Burning Man (click on the images to launch the infographics). 1: Mean Happiness This piece, which tracks happiness in countries over time, was designed by OPEN. See all their work for GOOD here. 2: The Almighty Dollar This piece, by Column Five Media, showed how much money different religions have. 3: Most Targeted Books Stanford Kay's piece looked at the books that parents most often ask to have removed from libraries. 4: Dead Man Walking This piece, which compares the pedestrian fatality rate in European and U.S. cities, is by Amanda Buck. 5: Someone in America Loves You.
13 of the Year's Best Infographics [Slideshow] Cool Infographics - Blog. Paul Laffoley's psychotronic schematic diagrams of metaphysical knowledge systems. 'Paul Laffoley was born into an Irish Catholic family in Cambridge, Massachusetts in 1940.
He spoke his first word, “Constantinople,” at six months, then remained silent until the age of four (having been diagnosed as slightly autistic), when he began to draw and paint. In his senior year at Brown University, he was given eight electric-shock treatments. He was dismissed from the Harvard Graduate School of Design, but managed to apprentice with the sculptor Mirko Baseldella, before going to New York to apprentice with the visionary architect Frederick Kiesler.
In 1968 he moved into an eighteen- by thirty-foot utility room to found a one-man “think tank” and creative unit called the Boston Visionary Cell. 'Laffoley supports himself with a job at the Boston Museum of Science, returning to the BVC not only to eat and sleep but to work on multimedia renderings of his visions of alternative futures and complex realities. Elsewhere. Infographics Blog: Reviews of the Best Infographic Design Ideas. Ideas, issues, knowledge, data - visualized! Densitydesign's Photostream. Les 50 meilleures infographics et data visualization. Chad Hagen’s ‘Nonsensical Infographics’ « Man Make Home. June 3, 2009 by manmakehome I stumbled on these fantastic ‘Nonsense Info Graphics’ from Chad Hagen on flickr today. Spend the rest of the afternoon trying to figure out what they’re actually charting! GDS Infographics' Photostream.
Motion graphics, animation, visual effects and direction for film and television - Onesize. 50 Great Examples of Data Visualization. Wrapping your brain around data online can be challenging, especially when dealing with huge volumes of information.

And trying to find related content can also be difficult, depending on what data you’re looking for. But data visualizations can make all of that much easier, allowing you to see the concepts that you’re learning about in a more interesting, and often more useful manner. Below are 50 of the best data visualizations and tools for creating your own visualizations out there, covering everything from Digg activity to network connectivity to what’s currently happening on Twitter.
Music, Movies and Other Media Narratives 2.0 visualizes music. Liveplasma is a music and movie visualization app that aims to help you discover other musicians or movies you might enjoy. Tuneglue is another music visualization service. MusicMap is similar to TuneGlue in its interface, but seems slightly more intuitive. Data Visualization. Information aesthetics - Information Visualization & Visual Communication. Infographics news. 40 Useful and Creative Infographics. Six Revisions Menu Main Categories CSS HTML JavaScript Web Design WordPress Web Development Design Inspiration UX Design UI Design Freebies Tutorials Tools Links About Contact Advertise RSS Twitter Facebook.