
7 Disruptive Innovations That Turned Their Markets Upside Down [INFOGRAPHIC] Who are the movers, the shakers, the companies that affect profound change?
![7 Disruptive Innovations That Turned Their Markets Upside Down [INFOGRAPHIC]](http://cdn.pearltrees.com/s/pic/th/innovations-infographic-17076531)
And what products do they bring to market that disrupt all others, making other companies completely re-think their strategies? Let's take a look at seven of those products whose competitors wish had never existed. That's what we'll find out with this infographic by professional networking site Focus.com. You'll see how 7 companies such as Skype, Netflix, Apple and Google rolled out products and services that approached their market in such a unique way that they changed everything. Besides those usual suspects, there are a few surprises in the group, too — products that lowered prices, approached their markets in unheard-of ways, even created new markets — and changed the world. Infographic on eBook Readers and the Book Publishing Industry. Over the last few years we have seen eBooks and eBook Readers rise as one of the fastest growing segments of the book publishing industry.

Let’s examine this infographic by RetailMeNot comparing eBooks, eBook readers and print books to get a better understanding of why that is. Each year the publishing industry in the United States produces over 2 billion books, 350 million magazines and 24 billion newspapers. These numbers come as no surprise when you consider that Americans purchase almost 5 million books per day. That works out to almost 57 books purchased per second. Considering Americans’ appetite for books, how has the introduction of eBooks and eBook readers impacted the publishing industry? eBook and Print Book Sales Over the last few years eBook sales have continued to grow, while print books have seen a gradual decline.
In 2008, eBook sales only made up 1.7% of book sales, for a total of about $61.4 million, while print took in $5.158 billion in sales. Adoption of eBook Readers. The History Of Radio. [Infographie Google] Comment le multi-écrans devient la norme. Google a publié hier une nouvelle étude consacrée aux habitudes « multi-écrans » des internautes.
![[Infographie Google] Comment le multi-écrans devient la norme](http://cdn.pearltrees.com/s/pic/th/infographie-comment-devient-116434654)
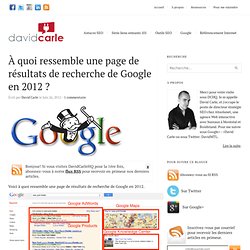
À quoi ressemble une page de résultats de recherche de Google en 2012 ? Voici à quoi ressemble une page de résultats de recherche de Google en 2012.

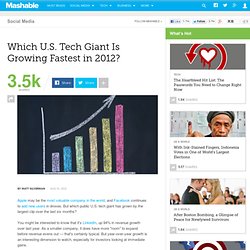
Tout comme moi, vous avez probablement remarqué que les résultats de recherche sont de plus en plus obstrués de résultats en provenance des différents services de Google. En effet, pour une recherche sous un mot-clé d’une concurrence moyenne/élevée, on peut facilement être présenté à : Which U.S. Tech Giant Is Growing Fastest in 2012? Apple may be the most valuable company in the world, and Facebook continues to add new users in droves.

But which public U.S. tech giant has grown by the largest clip over the last six months? You might be interested to know that it's LinkedIn, up 94% in revenue growth over last year. History-publishing-printing-press-infographic-.jpg (1008×1024) How technology is changing business. Tablet Owners Spend More Time and Money Shopping Online [INFOGRAPHIC] The increasing number of tablet owners in the U.S. is changing the way people shop from in-store to online — 20% of all mobile ecommerce sales now come from tablets and 60% of tablet owners have purchased goods using a tablet.
![Tablet Owners Spend More Time and Money Shopping Online [INFOGRAPHIC]](http://cdn.pearltrees.com/s/pic/th/category-shoppers-infographic-19271944)
Tablet users spend an average of one hour and 35 minutes on their devices and typically spend 10-20% more on purchases than shoppers without tablets. By 2016, mobile commerce is expected to increase to $31 billion in the U.S. - a tremendous jump from only $3 billion in 2010. Since tapping away on a tablet in the comfort of your home helps beat long lines and crowded department stores, it's no surprise that tablet owners are willing to spend more time and money shopping online.
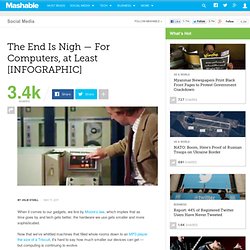
Check out the infographic below to see how tablets are directly affecting ecommerce in the U.S., a trend that is expected to continue for the next five years. The end of computers ! When it comes to our gadgets, we live by Moore's law, which implies that as time goes by and tech gets better, the hardware we use gets smaller and more sophisticated.

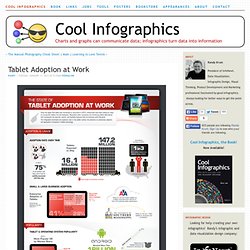
Now that we've whittled machines that filled whole rooms down to an MP3 player the size of a Triscuit, it's hard to say how much smaller our devices can get — but computing is continuing to evolve. In ten or twenty years, what we now call "computers" and how we do our computing are both guaranteed to be radically different and almost unrecognizable. In this REM-flavored infographic (which will surely get that song solidly stuck in your head for the rest of the day) we take a look at the progression of hardware from its beginnings in research to its future in quantum theory and even our own DNA. Click image to see full-size version. Tablet Adoption at Work. The State of Tablet Adoption at Work is a new infographic from VentureBeat.com.

It’s interesting that the infographic itself was sponsored by Lenovo and Qualcomm, but included as part of a VentureBeat article. You can find the original version here at TabletsAtWork.com. How Has Cloud Computing Impacted Businesses Around the World? [INFOGRAPHIC] Les Français et le numérique : l’infographie des usages. Typical Android User is Anything But Typical [INFOGRAPHIC] The History of Digital Storage [INFOGRAPHIC] The whirring hard drives that once occupied entire university labs held but a fraction of the data we carry in our pockets every day — and that's only 50 years of progress.
![The History of Digital Storage [INFOGRAPHIC]](http://cdn.pearltrees.com/s/pic/th/history-digital-infographic-17023040)
Today, as we move further into the cloud, and witness the latest and greatest pocket media devices, we thought it fitting to take a look back at how far we've come on our quest to store as much information in as little space as possible. 14 Epic Tech Fails That Will Live In Infamy [INFOGRAPHIC] Sometimes a stroll down memory lane is more interesting because of the garbage.
![14 Epic Tech Fails That Will Live In Infamy [INFOGRAPHIC]](http://cdn.pearltrees.com/s/pic/th/epic-fails-infamy-infographic-16540556)
We've collected a list of 14 tech train wrecks you may remember from back in the day — and even if you used some of them, we won't judge. Most of these products fizzled due to market competition, lack of consumer demand or just plan clunkiness. Others were cool for a time (especially if Leonard Nimoy said so), but were quickly surpassed by other groundbreaking technology. The list below is by no means exhaustive, so please share other tech flops you've witnessed over the years — that is, if you're willing to admit you used them. Dix ans de télévisions. Guerre des brevets : qui poursuit qui ? Une infographie. Mardi 23 août Divers - 23 août 2011 :: 12:38 :: Par Jean-Baptiste Petite infographie de Reuters qui résume l’état des procès récents et courants liés aux brevets entre les grandes compagnies High-Tech.
Je crois que « limpide » est le mot parfait pour décrire la clarté de la situation. Voila, c’est clair maintenant, non ? Quelques points que je remarque dans cette image et qui n’engagent que moi : Dans tous les cas il sera intéressant de voir le dénouement (si dénouement il y a) de cette guerre même s’il n’est pas pour demain avec par exemple la vente prochaine des brevets interDigital sur lesquels Apple ou Microsoft ou Google ne cracheraient probablement pas.
Plus d'infos sur : guerre brevets. The Dark Side of Google [Infographic] Proves That The Dark Side Is Winning. How Students Use Technology [INFOGRAPHIC] Mashable How Students Use Technology [INFOGRAPHIC] It's clear that today's students rely heavily on electronic devices even when they're not incorporated in the classroom. In one survey of college students, 38% said they couldn't even go 10 minutes without switching on some sort of electronic device. But how students are using their devices, how technology is affecting their educational experience, and what effect it has on their well-being are questions that are harder to answer. In the infographic below, online higher education database Onlineeducation.net has summed up some of the existing research on these points. What Happens When Your Phone Is Lost Or Stolen [INFOGRAPHIC]
If you've ever lost a phone or had your mobile device stolen, you probably have a better understanding than most of the costs and vulnerabilities involved. Your contacts, your login credentials, perhaps even your banking data is "out there," and it's up to you to try to lock it down or get it back. But the fact of the matter is, most of us are pretty lax about mobile security until something bad happens. Take a look at this data — all about how and where mobile devices are lost and stolen and what happens to them afterward — from mobile security company Lookout. Mac People vs. PC People [Infographic]
How Online Education Is Changing the Way We Learn [INFOGRAPHIC] Over the past decade or so, the Internet has become a huge source of information and education, especially for those who might be short on time, money or other resources. And it's not just crowdsourced data collections like Wikipedia or single-topic blogs that encourage individual learning; huge corporations and nonprofits are making online education and virtual classrooms a very formal affair these days. From the first online classes (which were conducted by the University of Phoenix in 1989) to the present day, when online education is a $34 billion industry, more and more students are finding new life and career education opportunities online. Check out this infographic from OnlineEducation.net about how the world of online learning has changed and grown over the years. Click image to see larger version.
How to Decide Whether Your Business Needs an App [INFOGRAPHIC] Does your company need a mobile app of its own? This question is something we think about a lot at Mashable, and the answer depends a lot on the kind of company and product or products in play. It also shifts based on the demographic you're targeting and the current state of the mobile landscape. One thing to consider is the cost. Apps Market. YouTube. (Cross-posted from the YouTube Blog) In May 2005, the YouTube founders launched YouTube.com, providing people with a platform to broadcast themselves to the world. Six years on, the world is watching and we wanted to say thank you to the YouTube community for a couple of amazing birthday presents. Skype > From conception to acquisition. The Development of the Camera: From Ancient to Instant. Remember when it took a week to see how the photos you took at the beach turned out?
The majority of the "Facebook generation" will never know the agony of opening up a $10 Walgreens envelope only to find that the precious pictures all have a blurry finger smudge over the lens. But then again, the rest of us will never know the joy of holding a camera still for hours while light burns a fuzzy image into a heavy silver and chalk plate — that's how they used to do it. Though Instagram and its ilk have empowered a recent surge of manic, amateur photo sharers, people have been camera crazy for centuries. Here's a quick look at the way the photo industry has developed, before and after paper was involved: More Photography Resources from Mashable: - iPhotography: 10 Pro Tips for Snapping Perfect iPhone Photos- 15 Incredible iPhone Dog Photographs- 7 Superb Short Films Shot With Cellphones- 10 Essential Websites for iPhone Photographers- 10 Incredible iPhone Portrait Photographs.
Canon & Nikon Cameras Square Off [INFOGRAPHIC] Online Television/Videos. Depuis l’apparition de Youtube et le succès de la vidéo en ligne, les chaînes ont décidé d’investir dans la diffusion de programmes en ligne voire dans la création de programmes exclusivement destinés au web. L'évolution des manettes de jeu de 1970 à nos jours.