
14 Body Language Styles In Business Meetings & What They Mean [Humor] If you are one of those people who has to attend a lot of business meetings, I feel for you.
![14 Body Language Styles In Business Meetings & What They Mean [Humor]](http://cdn.pearltrees.com/s/pic/th/language-business-meetings-68722211)
There’s nothing that can make you feel more annoyed, tired and like you are wasting precious time than sitting in a boring, unproductive meeting. Have you ever noticed your own posture in meetings? Have you ever thought about what that body language might be conveying? I haven’t…which is why I thought these illustrations were so funny. These are body language styles you might see in your business meetings. These quite perceptive illustrations were created by Nate Bolt, Design Research Manager at Facebook, in collaboration with illustrator Matt Huynh (and of course all the meeting participants who were observed for this very scientific research about the body language of meetings).
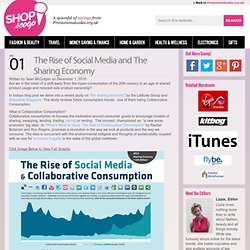
So now the question is, which one of these describes you? (and what their posture means) Click To Enlarge Via: [Design Taxi] Header Image Credit: [Growth Expert Blog] Video-game-evolution-history-infographic.png (PNG-Grafik, 975 × 3175 Pixel) - Skaliert (23. Social Media Monitoring: Effective Principles & Tactics. Something most brands don’t realize is that social media doesn’t make sense unless you keep a constant eye on it.
Without interaction, social media is not social. In order to yield any kind of positive result from social media, you will have to utilize social media monitoring in its purest form. You need to make sure you know what specific actions yield results, and what you can come to expect from being present on any social media platform. Without social media monitoring, your efforts can easily go unnoticed. There are many forms of social media monitoring, and finding the approach that gives you the best information is not as hard as you might think.
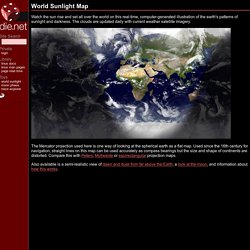
Some of these efforts can be found in a fresh infographic presented by Socialized! Twitter is a great platform for social media monitoring, and so is Facebook. Socialized!’ (Click Infographic To Enlarge) Header Image: [The People Equation] Graphics-Web. Combating-global-warming-infogrpahic. Hierarchy_distractions_960. 55 Interesting Social Media Infographics. Министерство финансов Российской Федерации. SeaCableHi.jpg (JPEG Image, 1703x1037 pixels) - Scaled (93%) The Rise of Social Media and The Sharing Economy. Written by Sean McColgan on December 1, 2010 Are we in the midst of a shift away from the hyper-consumption of the 20th century to an age of shared product usage and reduced sole product ownership?
In todays blog post we delve into a recent study on “the sharing economy” by the Latitude Group and Shareable Magazine. The study reviews future consumption trends, one of them being Collaborative Consumption. What is Collaborative Consumption? Collaborative consumption re-focuses the motivation around consumer goods to encourage models of sharing, swapping, lending, trading, saving or renting.
Click Image Below to View Full Graphic Embed This Graphic On Your Blog: <a href=" title="The Rise of Social Media and Collaborative Consumption"><img width="600" border="0" src=" alt="Collaborative Consumption"/></a><br/><a href=" Consumption Infographic</a> By <a href=" Codes</a> Like this post?
World Sunlight Map. Watch the sun rise and set all over the world on this real-time, computer-generated illustration of the earth's patterns of sunlight and darkness.
The clouds are updated daily with current weather satellite imagery. The Mercator projection used here is one way of looking at the spherical earth as a flat map. Used since the 16th century for navigation, straight lines on this map can be used accurately as compass bearings but the size and shape of continents are distorted. Compare this with Peters, Mollweide or equirectangular projection maps. Also available is a semi-realistic view of dawn and dusk from far above the Earth, a look at the moon, and information about how this works. World According to the United States of America.
This Spam Infographic About Spam Infographics Makes My Head Hurt. Wel2rekord-Panoramafoto von London: Sehen Sie Big Ben, London Eye, Tower Bridge und vieles mehr! Artoflistening.
Graphs Infographics.