
[Infographie] Classement des pages Facebook en France au 1er trimestre 2012. Social Consumers and the Science of Sharing [INFOGRAPHIC] If you're buying a car, do you check Facebook?
![Social Consumers and the Science of Sharing [INFOGRAPHIC]](http://cdn.pearltrees.com/s/pic/th/consumers-science-infographic-17790444)
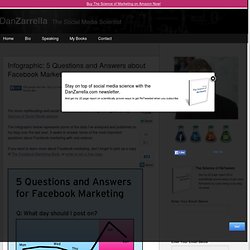
Or do you read up on Kelley Blue Book values and scour the company website for every spec, from horsepower to miles per gallon? What about music — do you check Top 40 radio charts or scope out what your Facebook friends are actually listening to on Spotify? Social media has infiltrated the purchasing funnel, helping consumers make informed decisions, from what to have for lunch to where to go on vacation. Depending on the decision, sometimes you turn to your social graph, and sometimes you turn to Google. Mediaventilo - Agence Social Media Web Marketing. 5 Questions and Answers about Facebook Marketing. For more mythbusting and social media science, don’t forget to register for my Science of Social Media webinar.

Facebook Is Asia’s 5th Largest Country. La percée de Facebook par continent sur un an. Top 40 Facebook Countries in Asia [INFOGRAPHIC] The Infographic of the day series visually expresses important stories from Asia and the world of technology.
![Top 40 Facebook Countries in Asia [INFOGRAPHIC]](http://cdn.pearltrees.com/s/pic/th/facebook-countries-infographic-26258151)
Update: We made changes to the flags — Sri Lanka and Malaysia. Facebook appears to be making some real progress in Asia. Back in February, we reported that there were 143 million Facebook users in the region. But now after five months, the figure has ballooned to 166 million, a 13.8 percent jump*. As Facebook approaches the one billion mark, Asia’s growth will play a huge role in helping the platform reach that figure. Tous les chiffres sur Facebook en vidéo. INFOGRAPHIC: The Real Cost Of Facebook. What if Facebook were a city?