
Fibonacci-E-Books. Financial Market Simulation - Artificial Stock Market model - News. Sophisticated Technology & Knowledge for Option Traders. Chaikin Oscillator. Introduction Developed by Marc Chaikin, the Chaikin Oscillator measures the momentum of the Accumulation Distribution Line using the MACD formula.
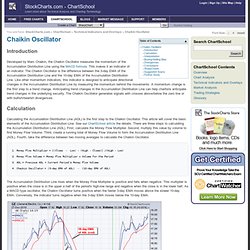
This makes it an indicator of an indicator. The Chaikin Oscillator is the difference between the 3-day EMA of the Accumulation Distribution Line and the 10-day EMA of the Accumulation Distribution Line. Like other momentum indicators, this indicator is designed to anticipate directional changes in the Accumulation Distribution Line by measuring the momentum behind the movements. A momentum change is the first step to a trend change. Calculation Calculating the Accumulation Distribution Line (ADL) is the first step to the Chaikin Oscillator. 1. The Accumulation Distribution Line rises when the Money Flow Multiplier is positive and falls when negative.
The chart above shows the Accumulation Distribution Line (gray) with the 3-day EMA in (blue) and the 10-day EMA (red). Interpretation Buying/Selling Bias Divergences Conclusions SharpCharts. Accumulation Distribution Line. Introduction Developed by Marc Chaikin, the Accumulation Distribution Line is a volume-based indicator designed to measure the cumulative flow of money into and out of a security.
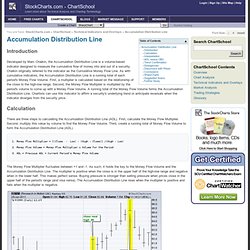
Chaikin originally referred to the indicator as the Cumulative Money Flow Line. As with cumulative indicators, the Accumulation Distribution Line is a running total of each period's Money Flow Volume. First, a multiplier is calculated based on the relationship of the close to the high-low range. Second, the Money Flow Multiplier is multiplied by the period's volume to come up with a Money Flow Volume. Calculation There are three steps to calculating the Accumulation Distribution Line (ADL). 1. The Money Flow Multiplier fluctuates between +1 and -1. The multiplier adjusts the amount of volume that ends up in the Money Flow Volume.
Click here for a calculation of the Accumulation Distribution Line in an Excel Spreadsheet. Interpretation ADL versus OBV. Download Grism - A stock market observation tool software for free. Technical Analysis Library - Documentation. FOX. Financial Market Simulation - Artificial Stock Market model - News.
Download Market Analysis System software for free. Risk Quantify. Merchant of Venice. Sharpe Ratio and Sortino Ratio for a Portfolio in SQL. Introduction to the Sharpe Ratio The Sharpe Ratio is commonly used by hedge funds, mutual funds, managed futures funds, and other money managers as a standardized way of reporting the level of risk the fund is using to achieve its returns.
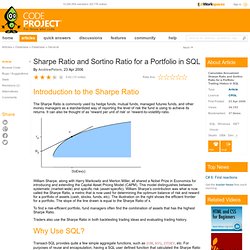
It can also be thought of as 'reward per unit of risk' or 'reward-to-volatility-ratio. William Sharpe, along with Harry Markowitz and Merton Miller, all shared a Nobel Prize in Economics for introducing and extending the Capital Asset Pricing Model (CAPM). This model distinguishes between systematic (market-wide) and specific risk (asset-specific). William Sharpe's contribution was what is now called the Sharpe Ratio, a metric that is now used for determining the optimum balance of risk and reward for a portfolio of assets (cash, stocks, funds, etc). To find a risk-efficient portfolio, fund managers often find the combination of assets that has the highest Sharpe Ratio.
Why Use SQL? The Algorithm Excess Return CREATE FUNCTION [dbo]. CREATE FUNCTION [dbo]. Download EclipseQuote software for free. Download JFinance software for free. Qtstalker - Commodity and stock market charting and technical analysis. Download EclipseTrader software for free. Download Stock Returns software for free.