
Taxes and the rich: Paying for it. Inequality: A monetary policy for the 1% The L-Curve: A Graph of the US Income Distribution. The Shocking, Graphic Data That Shows Exactly What Motivates the Occupy Movement. October 23, 2011 | Like this article?

Join our email list: Stay up to date with the latest headlines via email. What are the Occupy Wall Street protesters angry about? The same things we’re all angry about. Now is not the time for wonky policy solutions, as the media meatheads are calling for. 1. (click for larger version) The productivity/wage chart says it all. 2. (click for larger version) Actually the top tenth of one percent. 3. (click for larger version) As women entered the workforce, family income made up for some of the wage stagnation. 4. (click for larger version) To add financial insult to injury, the richest of the rich pay less and less each year as a percentage of their monstrous incomes. 5.
(click for larger version) When the rich become astronomically rich, they gamble with their excess money. 6. (click for larger version) We bailed out the big Wall Street banks and protected the billionaires from ruin. We Are The One Percent. Jobless Claims Saw Little Change Last Week; Four-Week Average Is Up : The Two-Way. The Scariest Chart in Europe Just Got Even Scarier - Derek Thompson. In March this year, for the first time on record, more than half of the young people in Spain and Greece were counted as unemployed by the OECD, which provided the chart above.
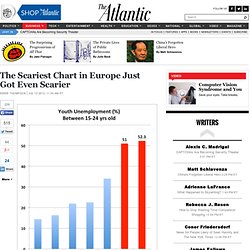
Three months later, the situation is still getting worse. Official youth unemployment in Greece and Spain has crossed 51 percent. That's worse than twice the rate of the entire euro zone (22%) and more than three times worse than the already-quite-bad youth unemployment in the United States and Canada (16% and 14%, respectively). The mitigating factor is that the OECD's metrics for unemployment might overstate the severity of youth joblessness. A separate measure of the world's so-called NEETs (not employed, in education, or training) put the figure closer to 20 percent in Greece and Spain. These economies got into trouble in different ways. Economist: It'll Get Worse For Average Americans. CHARTS: Here's What The Wall Street Protesters Are So Angry About... The "Occupy Wall Street" protests are gaining momentum, having spread from a small park in New York to marches to other cities across the country.

So far, the protests seem fueled by a collective sense that things in our economy are not fair or right. But the protesters have not done a good job of focusing their complaints—and thus have been skewered as malcontents who don't know what they stand for or want. (An early list of "grievances" included some legitimate beefs, but was otherwise just a vague attack on "corporations. " Given that these are the same corporations that employ more than 100 million Americans and make the products we all use every day, this broadside did not resonate with most Americans). So, what are the protesters so upset about, really? Do they have legitimate gripes? To answer the latter question first, yes, they have very legitimate gripes.