
JFreeChart: Combined Category Plot Demo 1 : Combined Category Plot Chart « Chart Combining Plots. R makes it easy to combine multiple plots into one overall graph, using either the par( ) or layout( ) function.
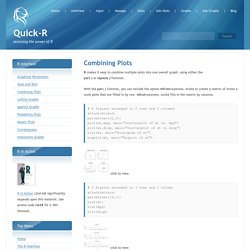
With the par( ) function, you can include the option mfrow=c(nrows, ncols) to create a matrix of nrows x ncols plots that are filled in by row. mfcol=c(nrows, ncols) fills in the matrix by columns. # 4 figures arranged in 2 rows and 2 columns attach(mtcars) par(mfrow=c(2,2)) plot(wt,mpg, main="Scatterplot of wt vs. mpg") plot(wt,disp, main="Scatterplot of wt vs disp") hist(wt, main="Histogram of wt") boxplot(wt, main="Boxplot of wt") click to view. JFreeChart: Overlaid XY Plot Demo 2 : Overlaid XY Plot Chart « Chart Line Chart « Chart
Jmvanel.free.fr/java/formation-ird3/jfreechart.pdf. JFreeChart: Line Chart Demo 6 : Line Chart « Chart