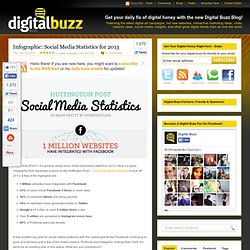

100 Social Media Statistics of 2012. iStrategyLabs has published an infographic on Social Media statistics from 2012, inspired by an article by Mark Ecko Enterprises digital marketing executive Brian Honigman, “100 Fascinating Social Media Statistics and Figures From 2012“.

ISL design intern Courtney Leonard captures insights on website integration with Facebook, Facebook user behaviour, the use of Twitter, the growth of Google+, the rise of Instagram, and the emergence of Pinterest. 1 Million websites have integrated with Facebook 23% of users check Facebook 5 times or more daily As of 2012, 210,000 years of music have been played on Facebook. 80 percent of social media users prefer to connect with brands through Facebook. The average Twitter user has tweeted 307 times. 56% of customer tweets are being ignored Since the dawn of Twitter, there’s been a total of 163 billion tweets. The top 5 of the top 100 hash tags on Instagram are #love, #instagood, #me, #tbt and #cute. Over 5 million are uploaded to Instagram every hour. Social Media Statistics for 2013 As we kick off 2013 it’s good to recap some of the impressive stats from 2012.

Here’s a great infographic that visualises a piece by the Huffington Post – 100 Social Media Statistics to kick off 2013. A few of the highlights are: 1 Million websites have integrated with Facebook 23% of users check Facebook 5 times or more daily56% of customer tweets are being ignored34% of marketers have generated leads on TwitterGoogle’s +1 button is used 5 million times a dayOver 5 million are uploaded to Instagram every hour80% of Pinterest users are female It was another big year for social media platforms with the mature giants like Facebook continuing to grow and develop and a few of the newer players, Pinterest and Instagram, making their mark. It’s set to be an exciting year in this space. Thanks for the Infographic iStrategyLabs. Be Sociable, Share! Social Media Report 2012. Facebook Explains The Four Ways It Sorts The News Feed And Insists Average Page Reach Didn’t Decrease. Today Facebook addressed the controversy surrounding the news feed and a reduction in reach for some Pages.

It outlined the four main factors that determine if a post shows up in the news feed, and insisted Page reach didn’t decrease overall. However a news feed algorithm change did start reducing reach for Pages that get complaints and that successfully cut total complaints by a double digit percentage. Facebook’s news feed product manager Will Cathcart told a room of reporters at Facebook’s headquarters this morning that “The problem we face with the news feed is that people come to Facebook everyday, but people don’t have enough time to check out absolutely everything that’s going on.” So to determine if any given Page post shows up in the news feed, Facebook looks at four main factors: Cathcart used a Star Wars-themed example to explain how these work.
Facebook made a major revision in September. There are conflicting reports about the actual impact on average reach, though. Facebook confirms it is testing new Timeline design with just one column for posts. Facebook recently started testing a new version of its Timeline design that cuts the number of columns for posts from two to one.

While there are still two columns, the left one is for items shared on a user’s profile (Wall posts, status updates, and so on) while the right one is for everything else you want on your profile (boxes for Friends, Photos, Places, and so on). In fact, the column on the left is made wider to accommodate all posts while the column on the right is narrower but still manages to include active modules. Facebook manages to pull this off by simply making the content on the right taller instead of wider (for example, the Friends box is 3×3 instead of the current 2×4). Here’s how the new design looks, courtesy of Inside Facebook: We reached out to Facebook to confirm this isn’t just a glitch, and boy were we thankful it isn’t.
This is how Timeline should have looked like from the start. Playing devil’s advocate, there are some minor flaws with this change. Infografía: Estadísticas de usuarios falsos en Facebook.