
Datatelling, an introduction « ddo. Have you heard of data visualisation? Of information visualisation? Maybe dataviz and infoviz ring a bell? Well, if you were among the first to use RSS feeds at the end of the 90s, if you started blogging before 2005, tweeting before 2008, using Quora.com before January 2011 or if you know what the word curation means and, last but not least, if you came across these lines, chances are you are quite familiar with dataviz or infoviz – at the very least with the good to great looking pieces you can find on Infosthetics , Visual Complexity, Flowing Data , Visualizing.org or Information is Beautiful . So there’s a lot of fuss in the air on the web, but what exactly are dataviz and infoviz? What’s their purpose?
Dataviz ≠ Infoviz A point of order to begin with. Today, visualization has the potential to become a mass medium. It should however be said that, of the two, dataviz is the one offering to look deeper into causes, reasons and correlations. Lies, damn lies and data? Data and Visualization: Predictions for 2011. A lot of my time these days goes into planning DataMarket‘s efforts in the new year.
An essential part of that is trying to grasp the major trends in areas that matter to us. DataMarket is building an active marketplace for statistics and structured data. We believe in a “visual data exploration” approach, meaning that users’ first experience with any data is a visualization that should provide a quick overview of what the data is all about, then allowing users to dig deeper to see the raw numbers, download the data in various formats, embed it in other web content or connect to the data live using our API. This vision, and our goals for the coming year – including our launch of an international data offering – frame the topics that I’ve been thinking about. For links to broader predictions in the fields of Big Data and Data-as-a-Service see the bottom of this post.
That said, here are the things I believe will shape our key areas of interest in 2011: Data Markets Chart solutions VC activity. Data Visualization for Non-Programmers: Impure. Impure is a new programming language designed to give non-programmers access to professional tools for data visualization.
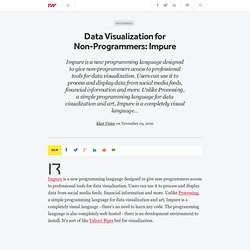
Users can use it to process and display data from social media feeds, financial information and more. Unlike Processing, a simple programming language for data visualization and art, Impure is a completely visual language - there's no need to learn any code. The programming language is also completely web hosted - there is no development environment to install. It's sort of like Yahoo!
Pipes but for visualization. Above is a sceenshot of Impure being used to process a Twitter feed. Although it's targeted at non-programmers, some basic programming knowledge would clearly be useful. Given the data deluge that many enterprise face, easy tools for data visualization should be in high demand - especially in areas like social monitoring. For some background on the joys of data visualization, check out this TED talk.