
A visual exploration on mapping complex networks. Knowledge Visualization. Tree of life. DJDESIGNERLAB - Find All Your Design Inspirations From This Laboratory. Information graphics or infographics are graphic visual representations of information, data or knowledge.

These graphics present complex information quickly and clearly, such as in signs, maps, journalism, technical writing, and education. With an information graphic, computer scientists, mathematicians, and statisticians develop and communicate concepts using a single symbol to process information. Today information graphics surround us in the media, in published works both pedestrian and scientific, in road signs and manuals. They illustrate information that would be unwieldy in text form, and act as a visual shorthand for everyday concepts such as “stop” and “go”.
Bus Ride 37 Mintutes An Information graphic of a 37minutes bus ride in singapore. Seeking Refuge Infographic Bicicelitte Digital Nostalgia Exploding Internet Italians social condition – Poverty – Adaptation – Inadaptado Cool Infographics: How Long Will It Last? The Medal is a World. 60 Creative Examples Of Infographics. <A HREF=" Widgets</A> Collected by noupe Today we have an exciting and enticing post which covers handy and innovative infographics.
Infographics is basically derived from two words: ‘information’ and ‘graphics’, and it stands for the graphical representation of data and information. have been often used in modern maps to incorporate variety of information, for instance for network designs, destination points, and local landmarks. Let’s take a look at some creative examples of beautiful infographics. Stunningly Creative Infographics The Most Dangerous Cities for Walking What People are Doing Online.
15 stunning examples. Data Visualization is a method of presenting information in a graphical form.

Good data visualization should appear as if it is a work of art. This intrigues the viewer and draws them in so that they can further investigate the data and info that the graphic represents. In this post there are 15 stunning examples of Data Visualization that are true works of art. Click on the title or image for a larger view of each visualization. The Strengths of Nations Here’s an image that discusses the variations in how different nations pursue science. Madrid.Citymurmur CityMurmur tries to understand and visualize how media attention reshapes the urban space and city. Genome Jules & Jim This visual represents the relationship between characters in the movie Jules & Jim. One Week of the Guardian This is one day in a series that takes the news from one week of the Guardian newspaper, and visually represents it as a series of static visualisations.
One Week of the Guardian Leisure & Poverty Stock Data Related Posts. 50 another great examples. Wrapping your brain around data online can be challenging, especially when dealing with huge volumes of information.

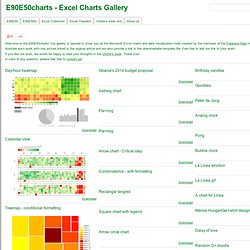
And trying to find related content can also be difficult, depending on what data you’re looking for. But data visualizations can make all of that much easier, allowing you to see the concepts that you’re learning about in a more interesting, and often more useful manner. 94 Incredible Infographics - From Alien Investigations to Social Media Beefs. Datavisualization.ch. E90E50charts - Excel Charts Gallery. Obama's 2014 budget proposal Iceberg chart Pie+ring Arrow chart - Critical step Combinatorics - with formatting Rectangle tangled Square chart with legend Arrow circle chart Percentage Chart Cherry chart Political climate radar - 2 Necklace double.
Dataviz : une belle boîte à outils. Exemples de dataviz. 12 Inspirationally Designed Infographics for Designers. Infographics have been a part of human communications since the invention of the first “writing” utensils.
Cave paintings, rock carvings, and sculptures have been found to integrate both images and written symbols (a type of pre-writing). These artistic efforts were created some 32,000 years ago; they illustrate stories, record history, religious ideas, and much more. Even among prehistoric people, infographics were an ideal method to communicate an infinite types of information. In modern terms, infographics are the visualizations or charts that are used to present a large amount of material to readers. This type of design is utilized to communicate information that would be impossible or too time-consuming to be explained solely by text or series of illustrations. Infographics continue to teach, inform, and entertain modern readers.
Below is a showcase of some brilliant infographics found around the net. America Hungry, Need Data Prism Social Media 2010 2012: The End Of The World?